

Genomic analysis of the appearance of ovarian mast cells in neonatal MRL/MpJ mice
- PMID: 24956472
- PMCID: PMC4067331
- DOI: 10.1371/journal.pone.0100617
Genomic analysis of the appearance of ovarian mast cells in neonatal MRL/MpJ mice
Abstract
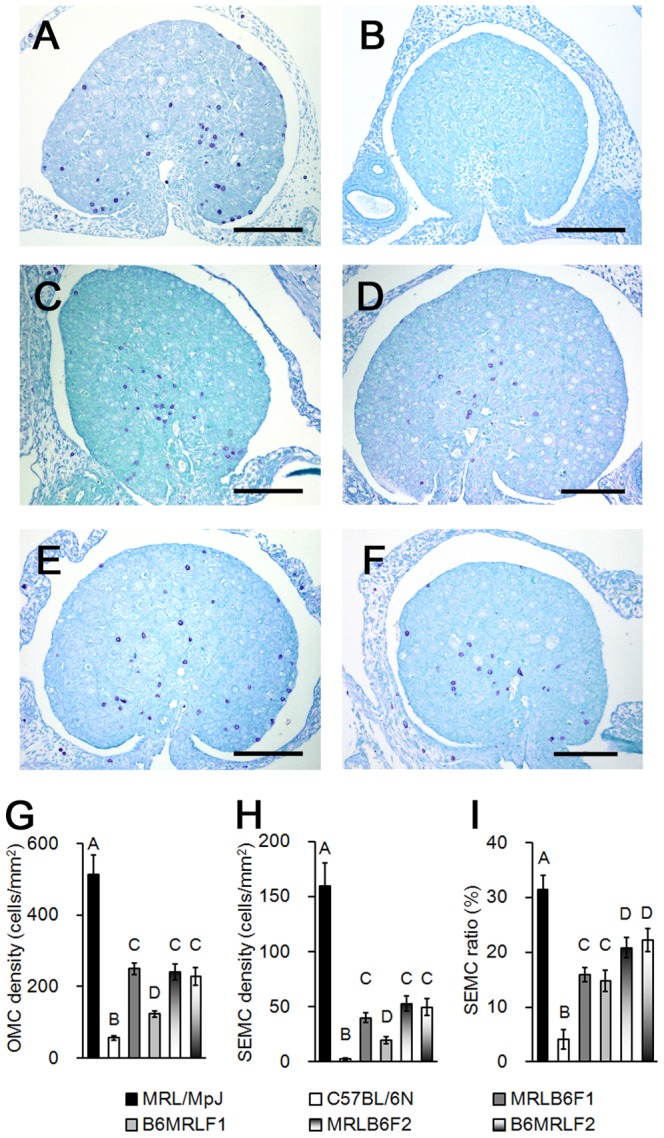
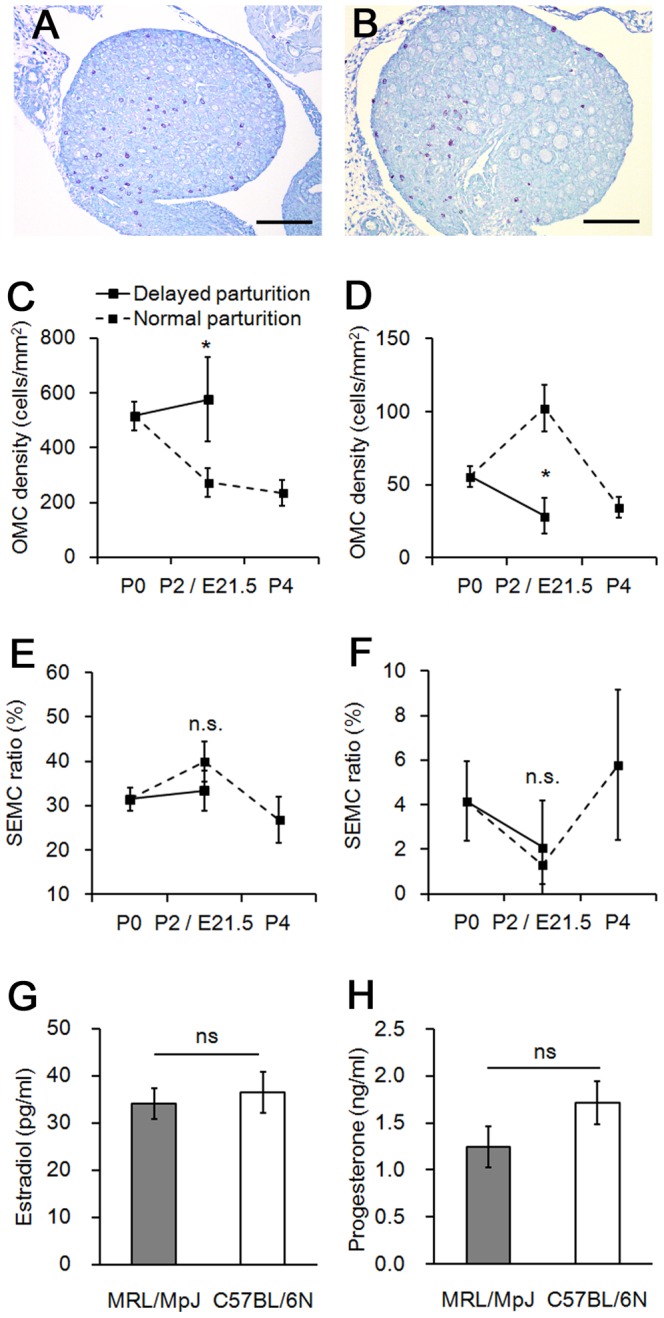
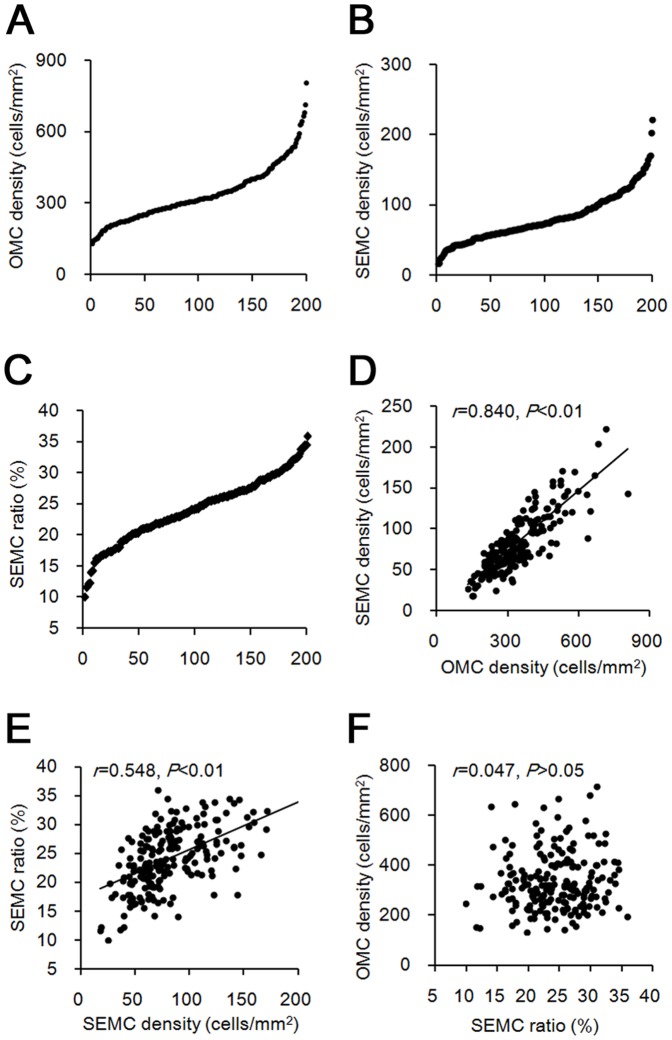
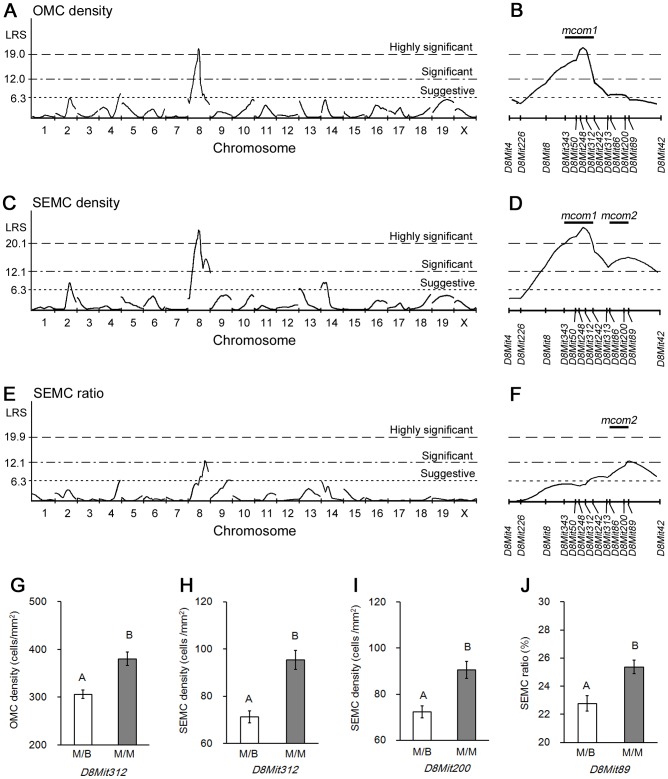
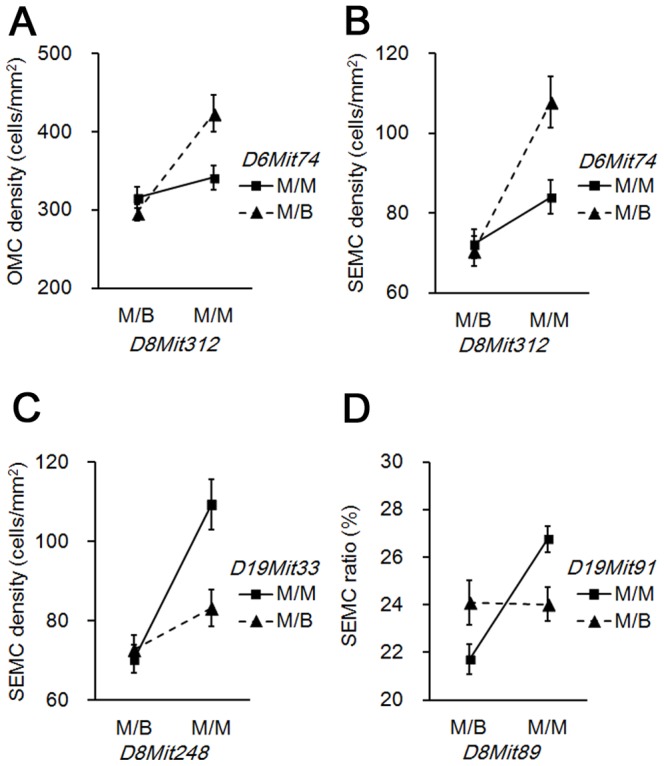
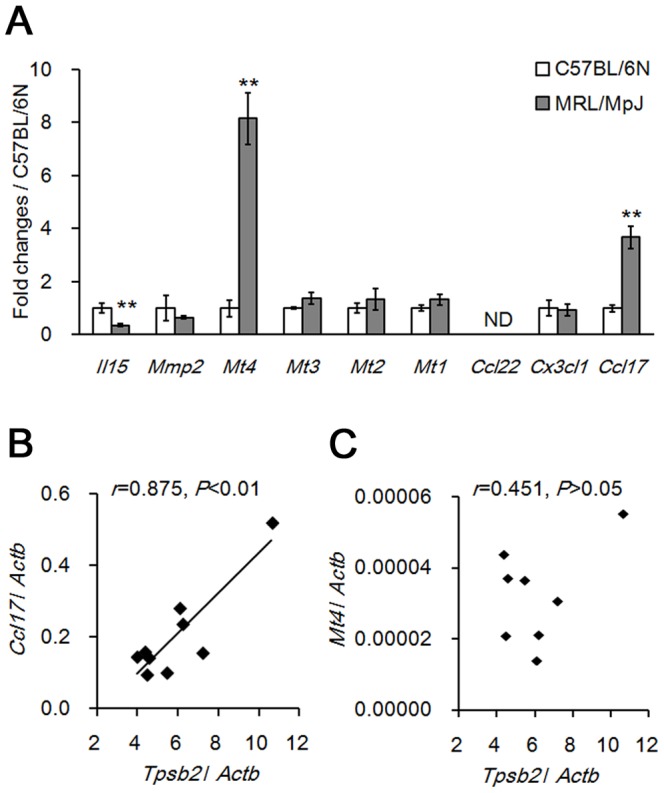
In MRL/MpJ mice, ovarian mast cells (OMCs) are more abundant than in other mouse strains, and tend to distribute beneath the ovarian surface epithelium at birth. This study investigated the factors regulating the appearance of neonatal OMCs in progeny of the cross between MRL/MpJ and C57BL/6N strains. F1 neonates had less than half the number of OMCs than MRL/MpJ. Interestingly, MRLB6F1 had more neonatal OMCs than B6MRLF1, although they were distributed over comparable areas. Furthermore, in MRL/MpJ fetuses for which parturition was delayed until embryonic day 21.5, the number of OMCs was significantly higher than in age-matched controls at postnatal day 2. These results suggest that the number of OMCs was influenced by the environmental factors during pregnancy. Quantitative trait locus analysis using N2 backcross progeny revealed two significant loci on chromosome 8: D8Mit343-D8Mit312 for the number of OMCs and D8Mit86-D8Mit89 for their distribution, designated as mast cell in the ovary of MRL/MpJ 1 (mcom1) and mcom2, respectively. Among MC migration-associated genes, ovarian expression of chemokine (C-C motif) ligand 17 at mcom1 locus was significantly higher in MRL/MpJ than in C57BL/6N, and positively correlated with the expression of OMC marker genes. These results indicate that the appearance of neonatal OMCs in MRL/MpJ is controlled by environmental factors and filial genetic factors, and that the abundance and distribution of OMCs are regulated by independent filial genetic elements.
Conflict of interest statement
Figures
Similar articles
-
Ovarian mast cells migrate toward ovary-fimbria connection in neonatal MRL/MpJ mice.PLoS One. 2018 Apr 23;13(4):e0196364. doi: 10.1371/journal.pone.0196364. eCollection 2018. PLoS One. 2018. PMID: 29684078 Free PMC article.
-
Relationship between numerous mast cells and early follicular development in neonatal MRL/MpJ mouse ovaries.PLoS One. 2013 Oct 4;8(10):e77246. doi: 10.1371/journal.pone.0077246. eCollection 2013. PLoS One. 2013. PMID: 24124609 Free PMC article.
-
Genomic analysis of the appearance of testicular oocytes in MRL/MpJ mice.Mamm Genome. 2012 Dec;23(11-12):741-8. doi: 10.1007/s00335-012-9405-3. Epub 2012 Jul 20. Mamm Genome. 2012. PMID: 22814868
-
Identifying a new locus that regulates the development of rete ovarian cysts in MRL/MpJ mice.Jpn J Vet Res. 2011 Aug;59(2-3):79-88. Jpn J Vet Res. 2011. PMID: 21977731
-
Quantitative trait locus analysis of ovarian cysts derived from rete ovarii in MRL/MpJ mice.Mamm Genome. 2010 Apr;21(3-4):162-71. doi: 10.1007/s00335-010-9254-x. Epub 2010 Feb 25. Mamm Genome. 2010. PMID: 20182879
Cited by
-
Ovarian mast cells migrate toward ovary-fimbria connection in neonatal MRL/MpJ mice.PLoS One. 2018 Apr 23;13(4):e0196364. doi: 10.1371/journal.pone.0196364. eCollection 2018. PLoS One. 2018. PMID: 29684078 Free PMC article.
References
-
- Galli SJ, Nakae S, Tsai M (2005) Mast cells in the development of adaptive immune responses. Nat Immunol 6: 135–142. - PubMed
-
- Robbie-Ryan M, Brown M (2002) The role of mast cells in allergy and autoimmunity. Curr Opin Immunol 14: 728–733. - PubMed
-
- Brännström M, Mayrhofer G, Robertson SA (1993) Localization of leukocyte subsets in the rat ovary during the periovulatory period. Biol Reprod 48: 277–286. - PubMed
Publication types
MeSH terms
Substances
LinkOut - more resources
Full Text Sources
Other Literature Sources
Molecular Biology Databases
