

Assessing dynamic spectral causality by lagged adaptive directed transfer function and instantaneous effect factor
- PMID: 24956616
- PMCID: PMC4068271
- DOI: 10.1109/TBME.2014.2311034
Assessing dynamic spectral causality by lagged adaptive directed transfer function and instantaneous effect factor
Abstract
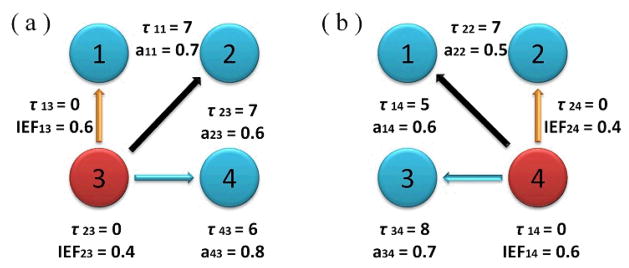
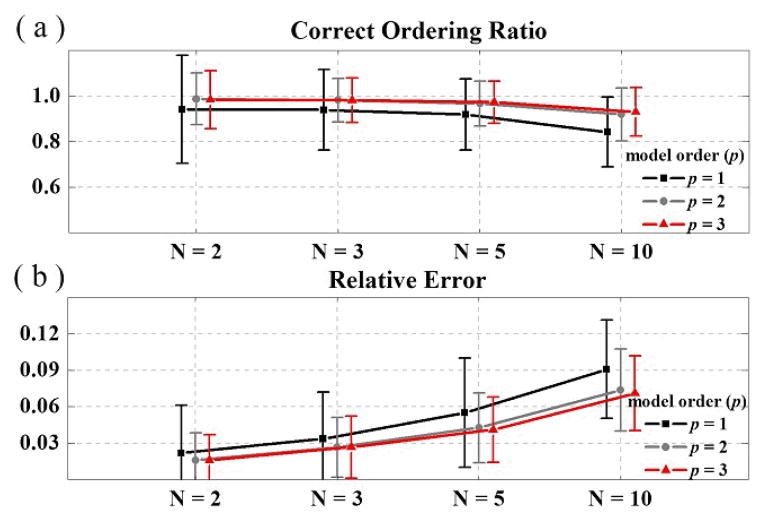
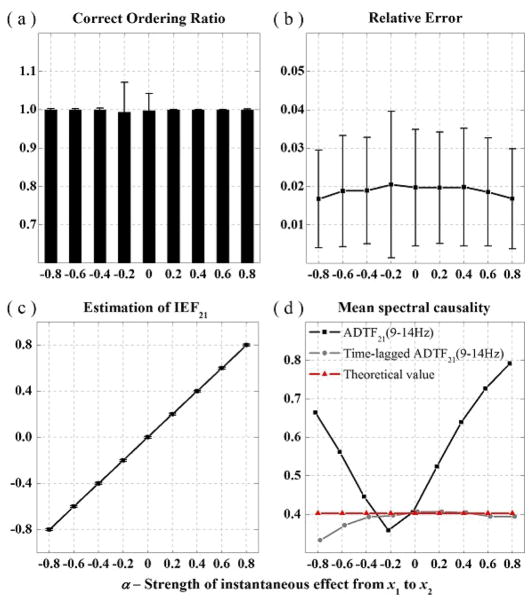
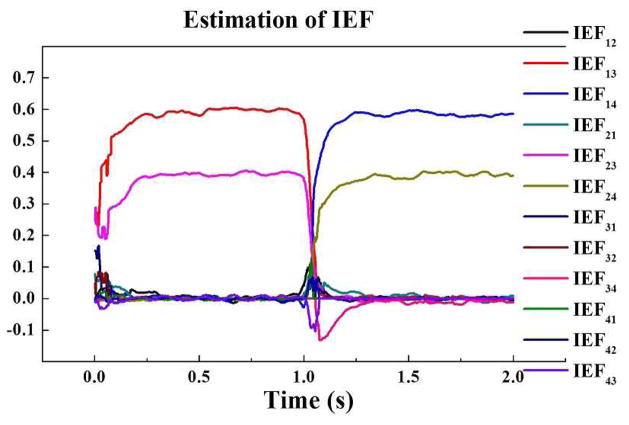
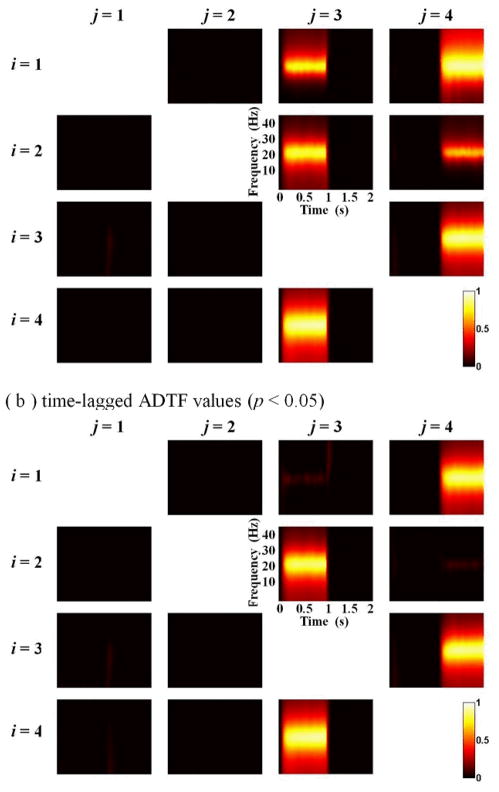
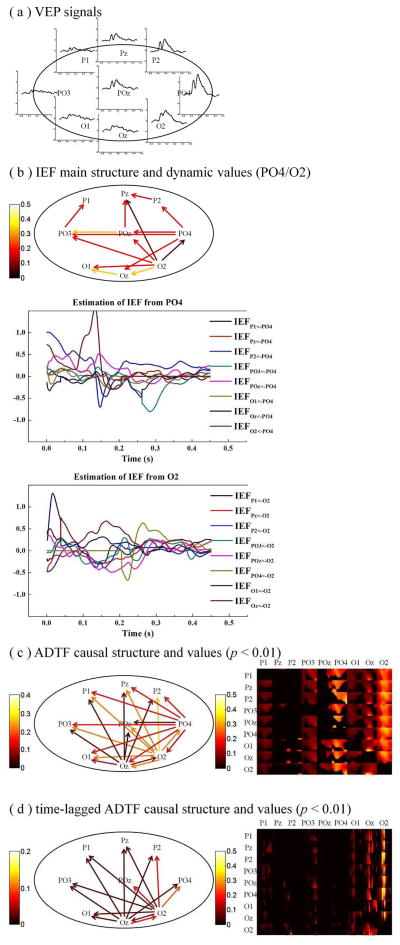
It is of significance to assess the dynamic spectral causality among physiological signals. Several practical estimators adapted from spectral Granger causality have been exploited to track dynamic causality based on the framework of time-varying multivariate autoregressive (tvMVAR) models. The nonzero covariance of the model's residuals has been used to describe the instantaneous effect phenomenon in some causality estimators. However, for the situations with Gaussian residuals in some autoregressive models, it is challenging to distinguish the directed instantaneous causality if the sufficient prior information about the "causal ordering" is missing. Here, we propose a new algorithm to assess the time-varying causal ordering of tvMVAR model under the assumption that the signals follow the same acyclic causal ordering for all time lags and to estimate the instantaneous effect factor (IEF) value in order to track the dynamic directed instantaneous connectivity. The time-lagged adaptive directed transfer function (ADTF) is also estimated to assess the lagged causality after removing the instantaneous effect. In this study, we first investigated the performance of the causal-ordering estimation algorithm and the accuracy of IEF value. Then, we presented the results of IEF and time-lagged ADTF method by comparing with the conventional ADTF method through simulations of various propagation models. Statistical analysis results suggest that the new algorithm could accurately estimate the causal ordering and give a good estimation of the IEF values in the Gaussian residual conditions. Meanwhile, the time-lagged ADTF approach is also more accurate in estimating the time-lagged dynamic interactions in a complex nervous system after extracting the instantaneous effect. In addition to the simulation studies, we applied the proposed method to estimate the dynamic spectral causality on real visual evoked potential (VEP) data in a human subject. Its usefulness in time-variant spectral causality assessment was demonstrated through the mutual causality investigation of brain activity during the VEP experiments.
Figures
Similar articles
-
An adaptive directed transfer function approach for detecting dynamic causal interactions.Annu Int Conf IEEE Eng Med Biol Soc. 2007;2007:4949-52. doi: 10.1109/IEMBS.2007.4353451. Annu Int Conf IEEE Eng Med Biol Soc. 2007. PMID: 18003117
-
Constructing Time-Varying Directed EEG Network by Multivariate Nonparametric Dynamical Granger Causality.IEEE Trans Neural Syst Rehabil Eng. 2022;30:1412-1421. doi: 10.1109/TNSRE.2022.3175483. Epub 2022 May 30. IEEE Trans Neural Syst Rehabil Eng. 2022. PMID: 35576427
-
A framework for assessing frequency domain causality in physiological time series with instantaneous effects.Philos Trans A Math Phys Eng Sci. 2013 Jul 15;371(1997):20110618. doi: 10.1098/rsta.2011.0618. Print 2013 Aug 28. Philos Trans A Math Phys Eng Sci. 2013. PMID: 23858484
-
Time, frequency, and time-varying Granger-causality measures in neuroscience.Stat Med. 2018 May 20;37(11):1910-1931. doi: 10.1002/sim.7621. Epub 2018 Mar 15. Stat Med. 2018. PMID: 29542141
-
Investigating effective brain connectivity from fMRI data: past findings and current issues with reference to Granger causality analysis.Brain Connect. 2012;2(5):235-45. doi: 10.1089/brain.2012.0091. Brain Connect. 2012. PMID: 23016794 Free PMC article. Review.
Cited by
-
Noninvasive Electromagnetic Source Imaging and Granger Causality Analysis: An Electrophysiological Connectome (eConnectome) Approach.IEEE Trans Biomed Eng. 2016 Dec;63(12):2474-2487. doi: 10.1109/TBME.2016.2616474. Epub 2016 Oct 11. IEEE Trans Biomed Eng. 2016. PMID: 27740473 Free PMC article.
-
The Influence of Listening to Music on Adults with Left-behind Experience Revealed by EEG-based Connectivity.Sci Rep. 2020 May 5;10(1):7575. doi: 10.1038/s41598-020-64381-x. Sci Rep. 2020. PMID: 32372046 Free PMC article.
References
-
- Bressler SL, Seth AK. Wiener-Granger Causality: A well established methodology. NeuroImage. 2011;58:323–329. - PubMed
-
- Wiener N. The theory of prediction. In: Beckenbach EF, editor. Modern Mathematics for the Engineer. New York: McGraw-Hill; 1956.
Publication types
MeSH terms
Grants and funding
LinkOut - more resources
Full Text Sources
Other Literature Sources
