

Interaction of myelin basic protein with cytoskeletal and signaling proteins in cultured primary oligodendrocytes and N19 oligodendroglial cells
- PMID: 24956930
- PMCID: PMC4078013
- DOI: 10.1186/1756-0500-7-387
Interaction of myelin basic protein with cytoskeletal and signaling proteins in cultured primary oligodendrocytes and N19 oligodendroglial cells
Abstract
Background: The classic myelin basic protein (MBP) isoforms are intrinsically-disordered proteins of 14-21.5 kDa in size arising from the Golli (Gene in the Oligodendrocyte Lineage) gene complex, and are responsible for formation of the multilayered myelin sheath in the central nervous system. The predominant membrane-associated isoform of MBP is not simply a structural component of compact myelin but is highly post-translationally modified and multi-functional, having interactions with numerous proteins such as Ca2+-calmodulin, and with actin, tubulin, and proteins with SH3-domains, which it can tether to a lipid membrane in vitro. It co-localizes with such proteins in primary oligodendrocytes (OLGs) and in early developmental N19-OLGs transfected with fluorescently-tagged MBP.
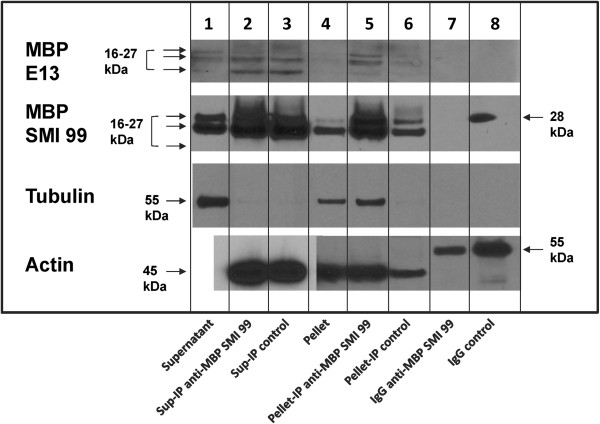
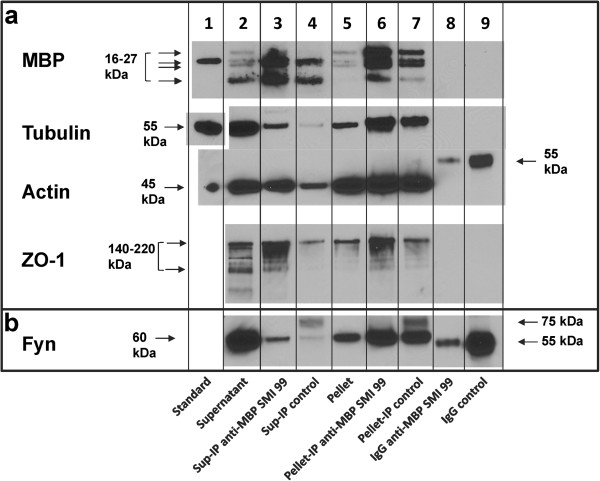
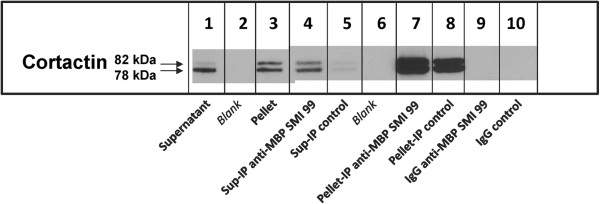
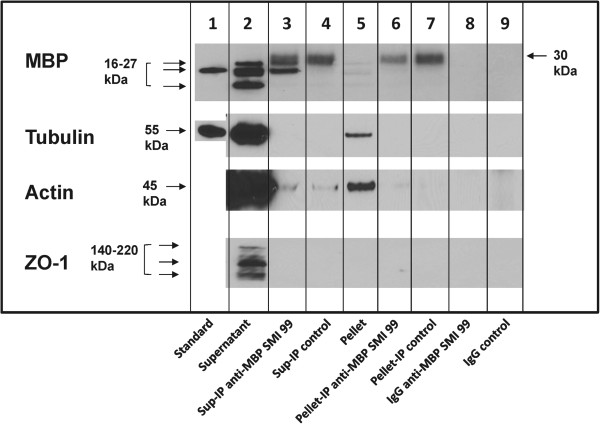
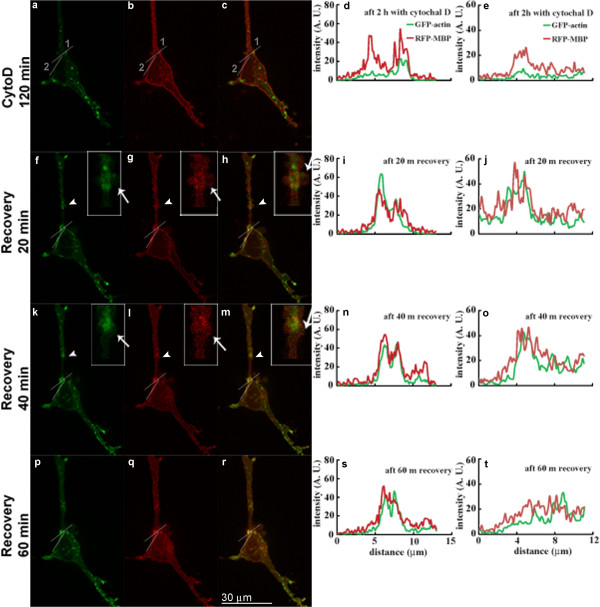
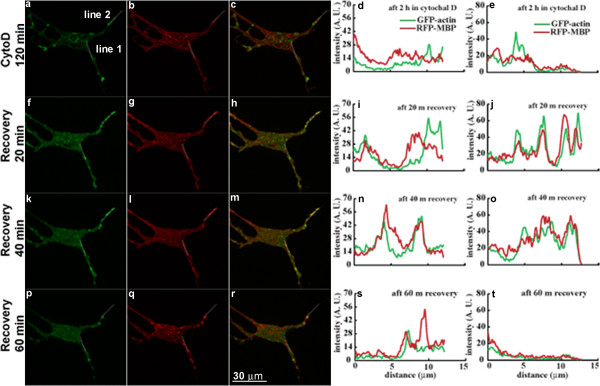
Results: To provide further evidence for MBP associations with these proteins in vivo, we show here that MBP isoforms are co-immunoprecipitated from detergent extracts of primary OLGs together with actin, tubulin, zonula occludens 1 (ZO-1), cortactin, and Fyn kinase. We also carry out live-cell imaging of N19-OLGs co-transfected with fluorescent MBP and actin, and show that when actin filaments re-assemble after recovery from cytochalasin D treatment, MBP and actin are rapidly enriched and co-localized at certain sites at the plasma membrane and in newly-formed membrane ruffles. The MBP and actin distributions change similarly with time, suggesting a specific and dynamic association.
Conclusions: These results provide more direct evidence for association of the predominant 18.5-kDa MBP isoform with these proteins in primary OLGs and in live cells than previously could be inferred from co-localization observations. This study supports further a role for classic MBP isoforms in protein-protein interactions during membrane and cytoskeletal extension and remodeling in OLGs.
Figures
Similar articles
-
Classic 18.5- and 21.5-kDa myelin basic protein isoforms associate with cytoskeletal and SH3-domain proteins in the immortalized N19-oligodendroglial cell line stimulated by phorbol ester and IGF-1.Neurochem Res. 2012 Jun;37(6):1277-95. doi: 10.1007/s11064-011-0700-2. Epub 2012 Jan 17. Neurochem Res. 2012. PMID: 22249765 Free PMC article.
-
Proline substitutions and threonine pseudophosphorylation of the SH3 ligand of 18.5-kDa myelin basic protein decrease its affinity for the Fyn-SH3 domain and alter process development and protein localization in oligodendrocytes.J Neurosci Res. 2012 Jan;90(1):28-47. doi: 10.1002/jnr.22733. Epub 2011 Sep 1. J Neurosci Res. 2012. PMID: 21887699 Free PMC article.
-
The 21.5-kDa isoform of myelin basic protein has a non-traditional PY-nuclear-localization signal.Biochem Biophys Res Commun. 2012 Jun 15;422(4):670-5. doi: 10.1016/j.bbrc.2012.05.051. Epub 2012 May 16. Biochem Biophys Res Commun. 2012. PMID: 22609403 Free PMC article.
-
Myelin basic protein: a multifunctional protein.Cell Mol Life Sci. 2006 Sep;63(17):1945-61. doi: 10.1007/s00018-006-6094-7. Cell Mol Life Sci. 2006. PMID: 16794783 Free PMC article. Review.
-
Myelin management by the 18.5-kDa and 21.5-kDa classic myelin basic protein isoforms.J Neurochem. 2013 May;125(3):334-61. doi: 10.1111/jnc.12195. Epub 2013 Mar 6. J Neurochem. 2013. PMID: 23398367 Free PMC article. Review.
Cited by
-
Single-synapse analyses of Alzheimer's disease implicate pathologic tau, DJ1, CD47, and ApoE.Sci Adv. 2021 Dec 17;7(51):eabk0473. doi: 10.1126/sciadv.abk0473. Epub 2021 Dec 15. Sci Adv. 2021. PMID: 34910503 Free PMC article.
-
The proline-rich region of 18.5 kDa myelin basic protein binds to the SH3-domain of Fyn tyrosine kinase with the aid of an upstream segment to form a dynamic complex in vitro.Biosci Rep. 2014 Dec 8;34(6):e00157. doi: 10.1042/BSR20140149. Biosci Rep. 2014. PMID: 25343306 Free PMC article.
-
Studying the Interactions of U24 from HHV-6 in Order to Further Elucidate Its Potential Role in MS.Viruses. 2022 Oct 28;14(11):2384. doi: 10.3390/v14112384. Viruses. 2022. PMID: 36366483 Free PMC article.
-
In-depth analysis of the Sirtuin 5-regulated mouse brain malonylome and succinylome using library-free data-independent acquisitions.Proteomics. 2023 Feb;23(3-4):e2100371. doi: 10.1002/pmic.202100371. Epub 2022 Dec 18. Proteomics. 2023. PMID: 36479818 Free PMC article.
-
Flexible Players within the Sheaths: The Intrinsically Disordered Proteins of Myelin in Health and Disease.Cells. 2020 Feb 18;9(2):470. doi: 10.3390/cells9020470. Cells. 2020. PMID: 32085570 Free PMC article. Review.
References
-
- Readhead C, Takasashi N, Shine HD, Saavedra R, Sidman R, Hood L. Role of myelin basic protein in the formation of central nervous system myelin. Ann N Y Acad Sci. 1990;605:280–285. - PubMed
-
- Trapp BD, Kidd GJ. In: Myelin Biology and Disorders. Volume 1. Lazzarini RA, Griffin JW, Lassman H, Nave K-A, Miller RH, Trapp BD, editor. San Diego: Elsevier Academic Press; 2004. Structure of the Myelinated Axon; pp. 3–27.
-
- Aggarwal S, Yurlova L, Snaidero N, Reetz C, Frey S, Zimmermann J, Pähler G, Janshoff A, Friedrichs J, Muller DJ, Goebel C, Simons M. A size barrier limits protein diffusion at the cell surface to generate lipid-rich myelin-membrane sheets. Dev Cell. 2011;21:445–456. - PubMed
-
- Simons M, Snaidero N, Aggarwal S. Cell polarity in myelinating glia: from membrane flow to diffusion barriers. Biochim Biophys Acta. 1821;2012:1146–1153. - PubMed
Publication types
MeSH terms
Substances
Grants and funding
LinkOut - more resources
Full Text Sources
Other Literature Sources
Miscellaneous
