. 2014 Jun 23;106(7):dju149.
doi: 10.1093/jnci/dju149. Print 2014 Jul.

ABCA transporter gene expression and poor outcome in epithelial ovarian cancer

Collaborators, Affiliations

ABCA transporter gene expression and poor outcome in epithelial ovarian cancer

Ellen L Hedditch et al. J Natl Cancer Inst. .

Abstract

Background: ATP-binding cassette (ABC) transporters play various roles in cancer biology and drug resistance, but their association with outcomes in serous epithelial ovarian cancer (EOC) is unknown.

Methods: The relationship between clinical outcomes and ABC transporter gene expression in two independent cohorts of high-grade serous EOC tumors was assessed with real-time quantitative polymerase chain reaction, analysis of expression microarray data, and immunohistochemistry. Associations between clinical outcomes and ABCA transporter gene single nucleotide polymorphisms were tested in a genome-wide association study. Impact of short interfering RNA-mediated gene suppression was determined by colony forming and migration assays. Association with survival was assessed with Kaplan-Meier analysis and log-rank tests. All statistical tests were two-sided.

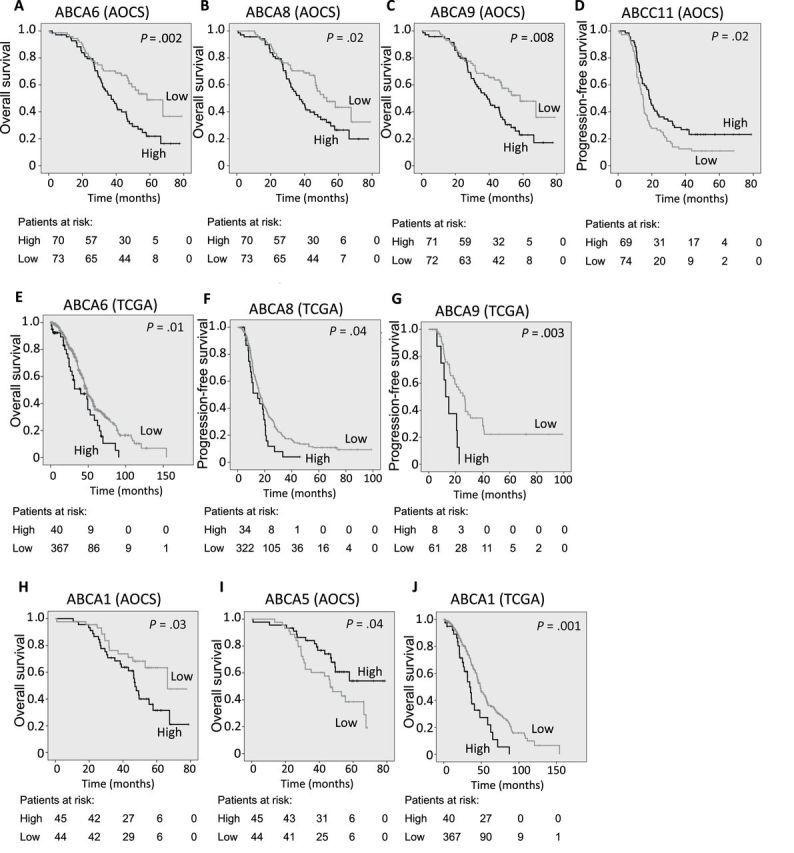
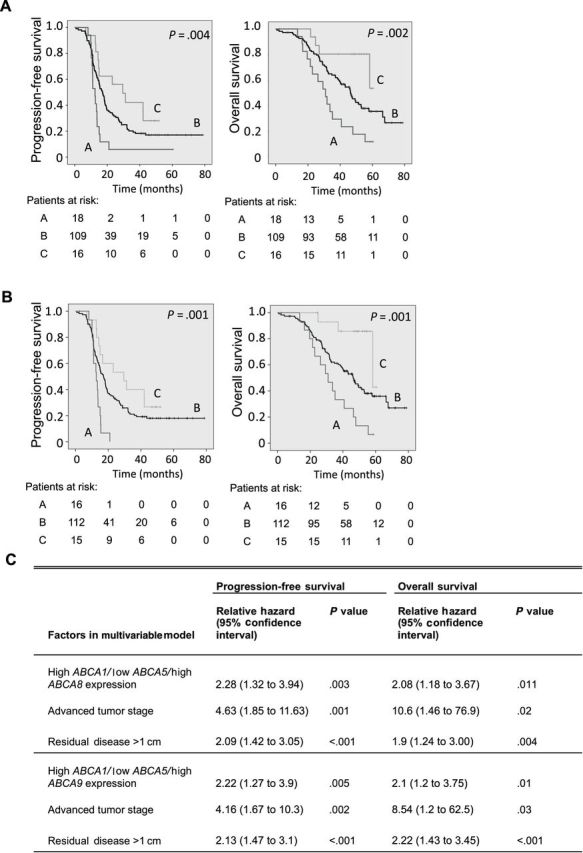
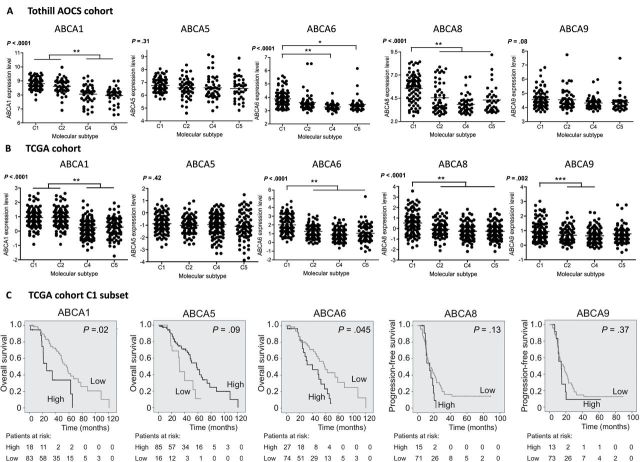
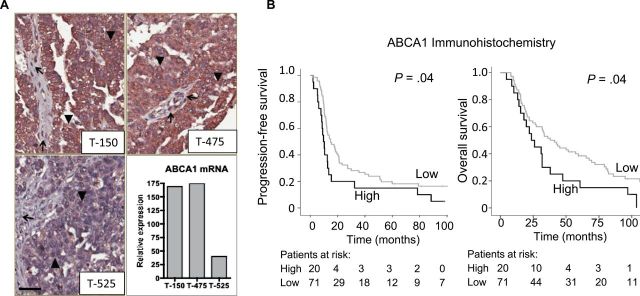
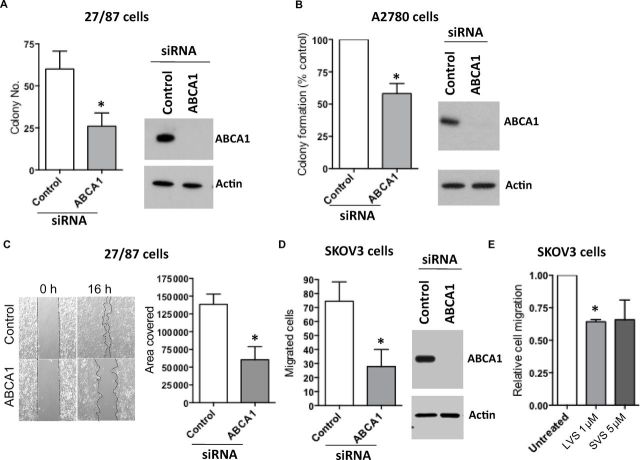
Results: Associations with outcome were observed with ABC transporters of the "A" subfamily, but not with multidrug transporters. High-level expression of ABCA1, ABCA6, ABCA8, and ABCA9 in primary tumors was statistically significantly associated with reduced survival in serous ovarian cancer patients. Low levels of ABCA5 and the C-allele of rs536009 were associated with shorter overall survival (hazard ratio for death = 1.50; 95% confidence interval [CI] =1.26 to 1.79; P = 6.5e-6). The combined expression pattern of ABCA1, ABCA5, and either ABCA8 or ABCA9 was associated with particularly poor outcome (mean overall survival in group with adverse ABCA1, ABCA5 and ABCA9 gene expression = 33.2 months, 95% CI = 26.4 to 40.1; vs 55.3 months in the group with favorable ABCA gene expression, 95% CI = 49.8 to 60.8; P = .001), independently of tumor stage or surgical debulking status. Suppression of cholesterol transporter ABCA1 inhibited ovarian cancer cell growth and migration in vitro, and statin treatment reduced ovarian cancer cell migration.

Conclusions: Expression of ABCA transporters was associated with poor outcome in serous ovarian cancer, implicating lipid trafficking as a potentially important process in EOC.


Figures

Figure 1.
Figure 1.
Kaplan–Meier survival analysis of ABCA gene expression in serous ovarian cancer. In the Australian Ovarian Cancer Study (AOCS) cohort, high expression of ABCA6 (A), ABCA8 (B) or ABCA9 (C) or low expression of ABCC11 (D) is associated with overall survival (OS) (AC) or progression-free survival (PFS) (D) in high-grade serous ovarian cancer. In The Cancer Genome Atlas (TCGA) cohort, high expression of ABCA6 (E) ABCA8 (F), or ABCA9 (G) is associated with OS (E) or PFS (F and G). In AOCS patients with 1cm or less of residual disease, high expression of ABCA1 (H) or low expression of ABCA5 (I) is associated with reduced OS, as is high expression of ABCA1 in the overall TCGA cohort (J). Kaplan–Meier curves were generated after dichotomization of gene expression to high or low expression with respect to the median for real-time quantitative PCR (RT-qPCR) data (AD, H, I) or upper decile for microarray data (EG, J) of expression among tumors, as described in the Methods. P values were calculated by two-sided log-rank tests.
Figure 2.
Figure 2.
Survival analysis by combined expression of the ABCA1, ABCA5, and ABCA8 or ABCA9 genes in Australian Ovarian Cancer Study (AOCS) patients. Patients were categorized into eight clusters on the basis of their combined ABCA1, ABCA5, and ABCA8 or ABCA9 expression pattern. Kaplan–Meier survival analysis of these clusters revealed three statistically distinct groupings (groups A, B, and C) that were associated with the risk of relapse associated with individual ABCA gene expression. A) Group A included only those patients whose tumors displayed high levels of ABCA1 and ABCA8 and low levels of ABCA5, reflecting unfavorable ABCA gene expression. Group C included only those patients whose tumors displayed low levels of ABCA1 and ABCA8 and high levels of ABCA5, reflecting favorable ABCA gene expression. Group B was comprised of all other patients. Kaplan–Meier survival graph shows progression-free and overall survival according to combined expression groupings in all patients. B) Group A included only those patients whose tumors displayed high levels of ABCA1 and ABCA9 and low levels of ABCA5. Group C included only those patients whose tumors displayed low levels of ABCA1 and ABCA9 and high levels of ABCA5. Group B was comprised of all other patients. Kaplan–Meier survival graph shows progression-free and overall survival according to combined expression groupings in all patients. P values for Kaplan–Meier curves in (A) and (B) were calculated according to two-sided log-rank tests. In each case, gene expression was classified as high or low with respect to the median. C) Multivariable Cox regression analysis of factors prognostic for outcome in serous ovarian cancers (all tumors). For the factor of combined ABCA gene expression, the comparison was made for group A vs all other patients. Relative hazards were calculated as the antilogs of the regression coefficients in the proportional hazards regression. Multivariable analysis was performed after inclusion of all listed prognostic factors into the Cox regression model.
Figure 3.
Figure 3.
Expression of ABCA1, ABCA5, ABCA6, ABCA8, and ABCA9 genes in serous carcinoma samples and clinical outcome according to molecular subtype classification. A) Expression data are derived from microarray-based gene expression profiling of 215 high-grade serous Australian Ovarian Cancer Study (AOCS) tumors (11). B) Expression data for 380 serous ovarian cancers were obtained through The Cancer Genome Atlas (TCGA) and were generated by University of North Carolina using the Agilent 244K Custom Gene Expression Array. P values displayed in (A) and (B) are from one-way analysis of variance. Horizontal lines indicate mean values. Asterisks indicate statistically significant differences in mean expression between C1 type and other types after Bonferroni correction: *P = .01; **P < .001; ***P < .05. C) Kaplan–Meier survival analysis of ABCA gene expression in C1 molecular subtype of serous ovarian cancer (TCGA expression array data). P values were calculated according to two-sided log-rank tests and Bonferroni adjustment for multiple testing. Gene expression was classified as high or low with respect to the upper decile (ABCA1, ABCA6, ABCA8, ABCA9) or lower quartile (ABCA5) of expression.
Figure 4.
Figure 4.
High ABCA1 protein levels in serous tumors are associated with poor outcome. A) Immunohistochemistry using ABCA1 antibody shows two tumors with intense staining in epithelial cells (arrowheads; top images) accompanied by weaker staining of stromal cells (arrows), whereas tumor 525 had low expression overall (bottom left). Scale bar = 50 μm. The highly stained tumors had relatively high expression by real-time quantitative PCR (RT-qPCR) (bottom right). B) Kaplan–Meier survival analysis of ABCA1 protein gene expression in 91 samples of a tumor tissue microarray. ABCA1 expression was classified as high or low according to intensity of staining, which was scored as described in the Supplementary Methods (available online). P values were calculated according to two-sided log-rank tests.
Figure 5.
Figure 5.
Impact of ABCA1 expression on epithelial ovarian cancer (EOC) cell growth and migratory capacity. A) Short interfering RNA (siRNA)–mediated suppression of ABCA1 in 27/87 ovarian cancer cells (5nM siRNA; 48 hours after transfection) leads to growth inhibition, as measured by colony formation. *P = .002. B) siRNA-mediated suppression of ABCA1 in A2780 ovarian cancer cells (5nM siRNA; 48 hours after transfection) leads to growth inhibition, as measured by colony formation. *P = .01. C) siRNA-mediated suppression of ABCA1 impairs wound closure ability in 27/87 cells. Measurement was taken at 16 hours after chamber removal and is expressed as area of wound covered (arbitrary units). *P = .004. D) siRNA-mediated suppression of ABCA1 impairs cell migratory ability in SKOV3 cells. Forty-eight hours after siRNA transfection, cells were allowed to migrate across the Transwell membrane. *P = .01. E) Inhibition of the cholesterol synthesis pathway impairs SKOV3 cell migration. Eighteen hours after treatment with lovastatin (LVS) or simvastatin (SVS), cells were allowed to migrate across the Transwell membrane. *P < .001. For (D) and (E), the number of cells migrated in five fields was counted for each of three replicate wells and expressed as a percentage of control cells migrating. P values were derived from Student t test in parts (A), (C), and (D) and one-sample t test in parts (B) and (E). All data shown represent the mean of at least three independent experiments. Error bars represent standard deviations.

Similar articles

Cited by

References

    1. Levi F, Lucchini F, Negri E, et al. Cancer mortality in Europe, 1995–1999, and an overview of trends since 1960. Int J Cancer. 2004;110(2):155–169 - PubMed
    1. Dean M. The genetics of ATP-binding cassette transporters. Methods Enzymol. 2005;400:409–429 - PubMed
    1. Szakacs G, Annereau JP, Lababidi S, et al. Predicting drug sensitivity and resistance: profiling ABC transporter genes in cancer cells. Cancer Cell. 2004;6(2):129–137 - PubMed
    1. Fletcher JI, Haber M, Henderson MJ, et al. ABC transporters in cancer: more than just drug efflux pumps. Nat Rev Cancer. 2010;10(2):147–156 - PubMed
    1. Wang D, Dubois RN. Eicosanoids and cancer. Nat Rev Cancer. 2010;10(3):181–193 - PMC - PubMed

Publication types

MeSH terms