. 2014 Jun 23;106(7):dju158.
doi: 10.1093/jnci/dju158. Print 2014 Jul.

Effects of obesity on transcriptomic changes and cancer hallmarks in estrogen receptor-positive breast cancer

Affiliations

Effects of obesity on transcriptomic changes and cancer hallmarks in estrogen receptor-positive breast cancer

Enrique Fuentes-Mattei et al. J Natl Cancer Inst. .

Abstract

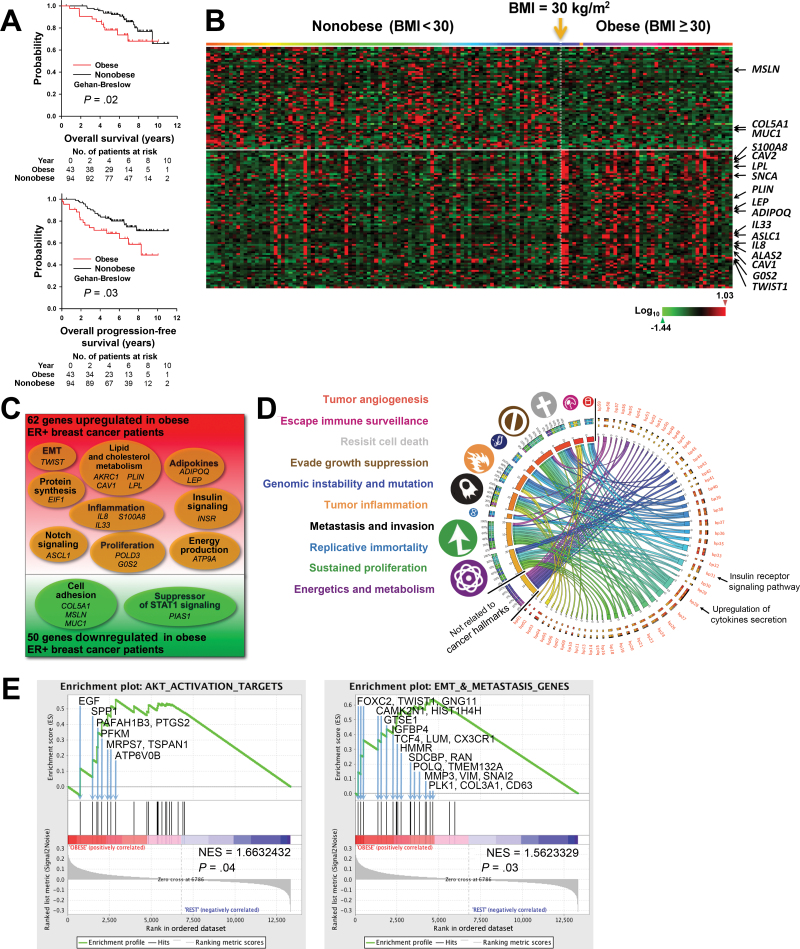
Background: Obesity increases the risk of cancer death among postmenopausal women with estrogen receptor-positive (ER+) breast cancer, but the direct evidence for the mechanisms is lacking. The purpose of this study is to demonstrate direct evidence for the mechanisms mediating this epidemiologic phenomenon.

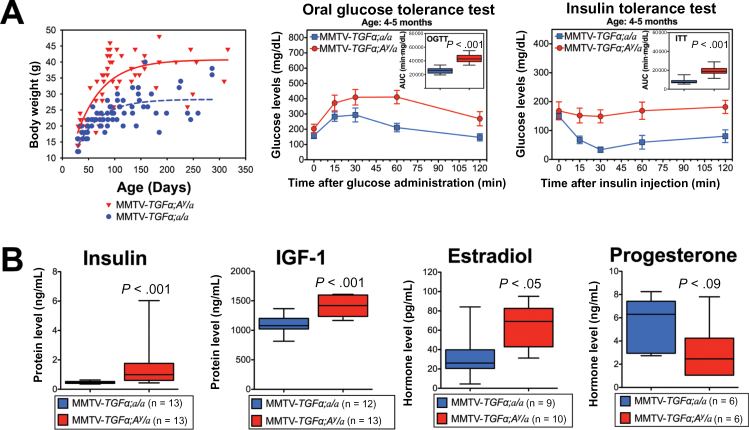
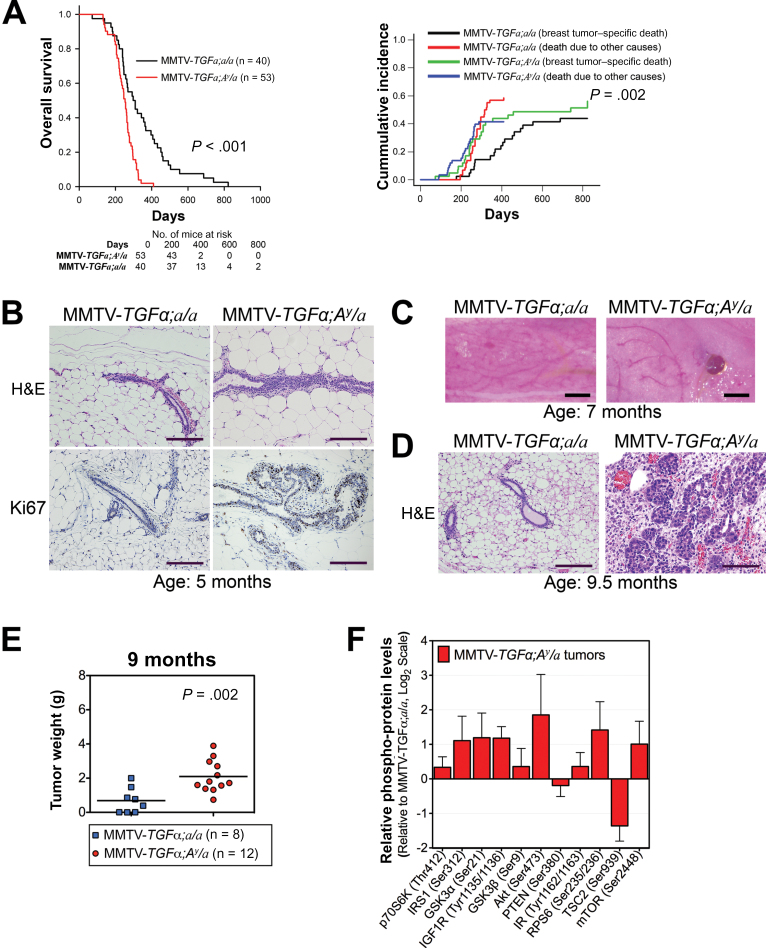
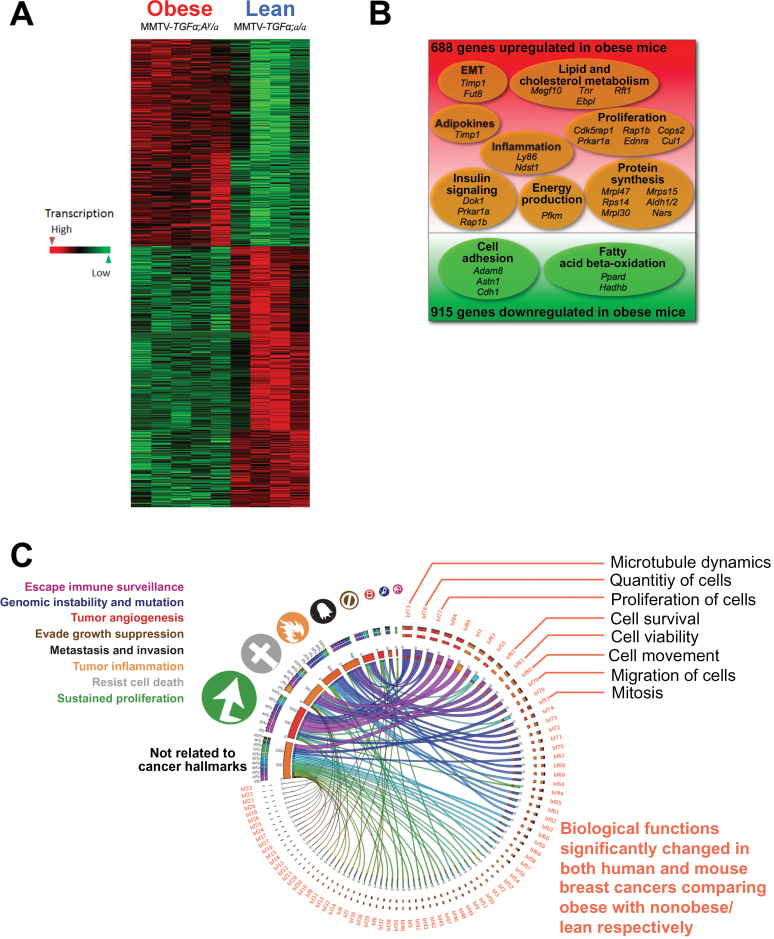
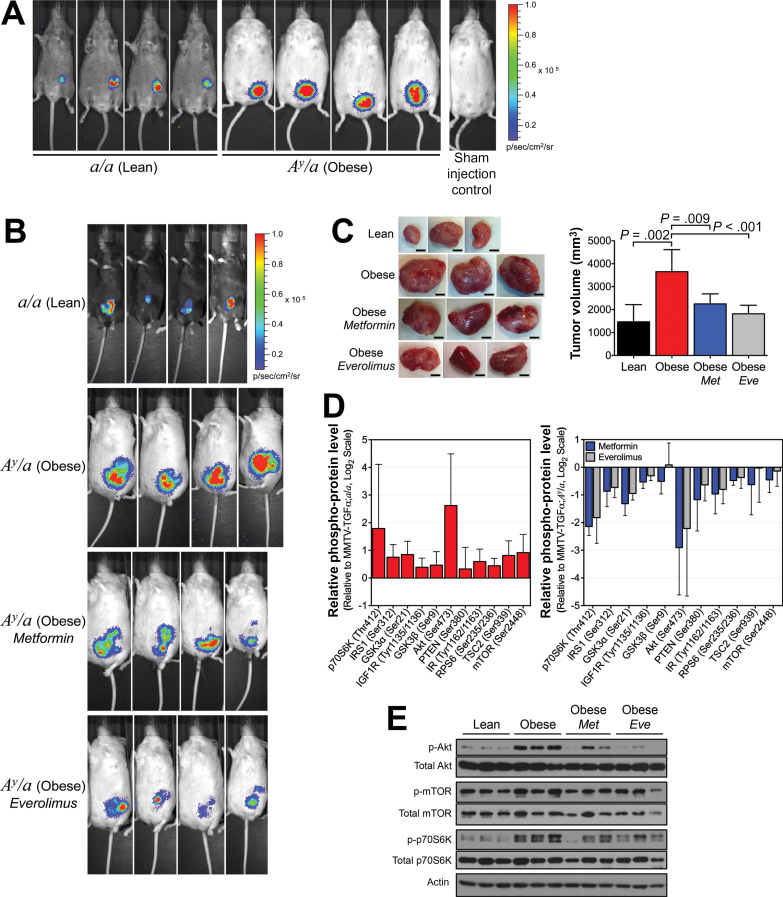
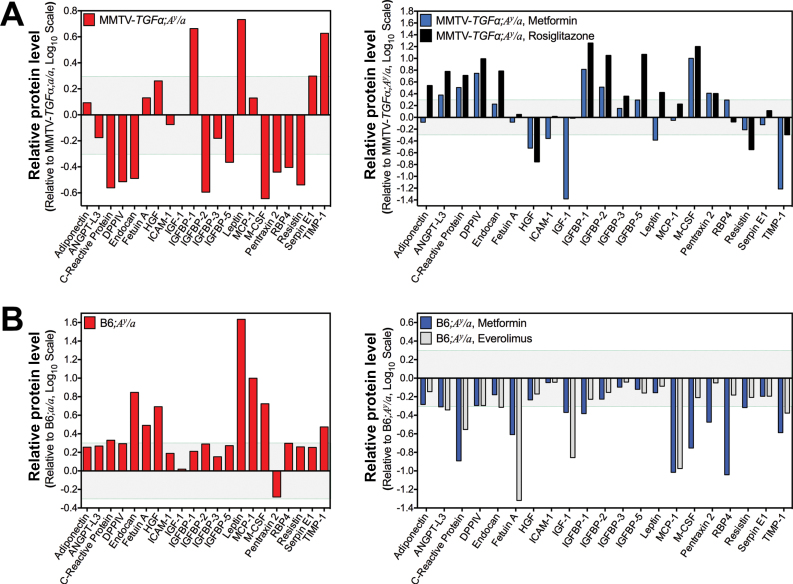
Methods: We analyzed transcriptomic profiles of pretreatment biopsies from a prospective cohort of 137 ER+ breast cancer patients. We generated transgenic (MMTV-TGFα;A (y) /a) and orthotopic/syngeneic (A (y) /a) obese mouse models to investigate the effect of obesity on tumorigenesis and tumor progression and to determine biological mechanisms using whole-genome transcriptome microarrays and protein analyses. We used a coculture system to examine the impact of adipocytes/adipokines on breast cancer cell proliferation. All statistical tests were two-sided.

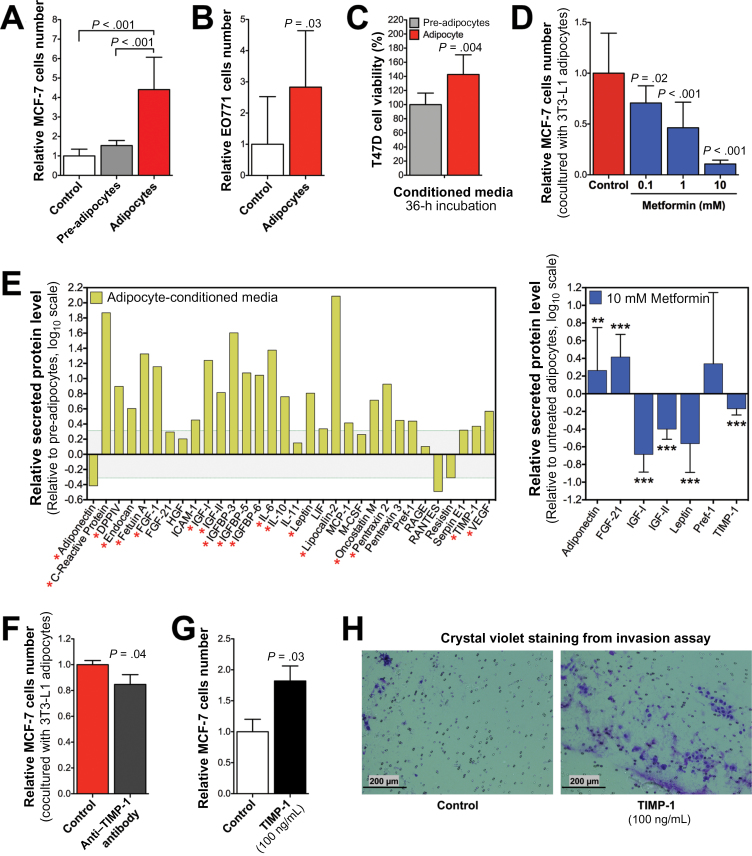
Results: Functional transcriptomic analysis of patients revealed the association of obesity with 59 biological functional changes (P < .05) linked to cancer hallmarks. Gene enrichment analysis revealed enrichment of AKT-target genes (P = .04) and epithelial-mesenchymal transition genes (P = .03) in patients. Our obese mouse models demonstrated activation of the AKT/mTOR pathway in obesity-accelerated mammary tumor growth (3.7- to 7.0-fold; P < .001; n = 6-7 mice per group). Metformin or everolimus can suppress obesity-induced secretion of adipokines and breast tumor formation and growth (0.5-fold, P = .04; 0.3-fold, P < .001, respectively; n = 6-8 mice per group). The coculture model revealed that adipocyte-secreted adipokines (eg, TIMP-1) regulate adipocyte-induced breast cancer cell proliferation and invasion. Metformin suppress adipocyte-induced cell proliferation and adipocyte-secreted adipokines in vitro.

Conclusions: Adipokine secretion and AKT/mTOR activation play important roles in obesity-accelerated breast cancer aggressiveness in addition to hyperinsulinemia, estrogen signaling, and inflammation. Metformin and everolimus have potential for therapeutic interventions of ER+ breast cancer patients with obesity.


Figures

Figure 1.
Figure 1.
Transcriptomic changes and adverse clinical outcomes associated with obesity in a prospective cohort of estrogen receptor–positive (ER+) breast cancer (BC) patients. A) Kaplan–Meier analysis of the overall survival (left panel) and progression-free survival (right panel) of untreated ER+ BC patients in Gene Expression Omnibus dataset GSE-20194 who were obese (body mass index [BMI] ≥ 30.0kg/m2; red; n = 43) or nonobese (BMI < 30kg/m2; black; n = 94). Gehan–Breslow test was used to calculate the P values. B) Heat map of the 130 gene probes with statistically significant changed expression (P ≤ .01; log ratio > 0.1) appearing in the same order as in Supplementary Table 3 (available online). Patients were arranged in ascending order of BMI from left to right. BMI of 30kg/m2 is indicated by the yellow arrow. C) Venn diagram of microarray data of pretreatment tumor biopsies, which identified 112 genes with statistically significantly changed expression (P ≤ .01; log ratio > 0.1) between obese and nonobese patients. D) Circos plot of the connections of statistically significantly changed biological processes (bp01 to bp50; P<.05) (see also Supplementary Table 4, available online) to cancer hallmarks (symbols and color-coded labels at left). The widths of the connectors represent the absolute values of the biological process Z scores. E) Gene set enrichment analyses (GSEAs) for AKT activation target genes (left panel) and genes involve in the epithelial–mesenchymal transition (EMT) and metastasis (right panel). Each bar corresponds to one gene. GSEA results with gene symbol, gene name, and gene enrichment scores of all genes included in each gene set are listed in Supplementary Table 5 and Supplementary Table 8 (available online).
Figure 2.
Figure 2.
MMTV-TGFα:A y /a obese mice: a genetic mouse model of obesity and breast cancer (BC). A) Plotted body weight of MMTV-TGFα;A y /a obese mice (red) and MMTV-TGFα;a/a lean mice (blue) (left panel), oral glucose tolerance test results (middle panel; n = 11 mice per group), and insulin tolerance test results (right panel; n = 13 mice per group). Statistical significance was calculated by two-tailed t test of the area under the curves from the two groups of mice. B) Box plots of hormone levels for obese mice (red) and lean mice (blue). Error bars in all panels represent 95% confidence intervals. Statistically comparisons were performed using two-tailed t test.
Figure 3.
Figure 3.
Effect of obesity on oncogene-driven breast carcinogenesis and tumor progression in mice. A) Kaplan–Meier analysis of overall survival (left panel) and Fine–Gray competing risk analysis of breast tumor–specific death (right panel). Two-sided log-rank test (left panel) and Fine–Gray competing risk analysis (right panel) were used to calculate the P values. B) Representative hematoxylin and eosin (H&E)–stained slides (top panels) and Ki67 immunohistochemical analysis (bottom panels) of mammary ductal epithelium. Images were captured at ×10 magnification, and scale bars represent 200 µm. C) Representative pictures of fourth mammary fat pads illustrating a difference in tumor formation. Scale bars represent 1mm. D) Representative hematoxylin and eosin–stained slides of mouse mammary tissue. Images were captured at ×10 magnification, and scale bars represent 200 µm. E) Tumor weights of obese mice (blue) and lean mice (red) killed at the age of 9 months in the cross-sectional study. Statistical significance was calculated by two-tailed t test. F) Phospho-protein levels of members of the AKT/mTOR signaling pathway from tumor lysates of MMTV-TGFα;A y /a obese mice (n = 7) plotted relative to those from MMTV-TGFα;a/a lean mice (n = 5). Error bars in panel (F) and Supplementary Figure 3 represent 95% confidence intervals.
Figure 4.
Figure 4.
Transcriptomic changes associated with obesity by comparing breast cancers (BCs) from obese and lean mice, and comparison of overall transcriptomic landscape with that of human estrogen receptor–positive (ER+) BCs. A) Heat map of differentially expressed genes in BCs showed clear clustering with sharp differences between MMTV-TGFα;A y /a obese mice (n = 5) and MMTV-TGFα;a/a lean mice (n = 5). B) Venn diagram of microarray data of transgenic mouse tumors identified 1603 genes with statistically significantly changed expression (n = 5 mice per group). C) Circos plot (http://mkweb.bcgsc.ca/tableviewer) of the relationships among biological functions (bf01 to bf85; Supplementary Table 7, available online) affected by obesity in both humans and mice and cancer hallmarks. The width of each link represents the average of the absolute values of the Z scores for humans and mice. Obesity promoted functions associated with sustained proliferation, resistance to cell death, tumor-promoting inflammation, metastasis and invasion, and so on in ER+ BCs of both humans (obese: n = 43; nonobese: n = 94) and mice (n = 5 mice per group).
Figure 5.
Figure 5.
Effect of obesity on breast cancer progression and tumor growth in orthotopic/syngeneic mice. A) Representative in vivo bioluminescent imaging of tumors performed 4 weeks after orthotopic/syngeneic allografting of EO771-FG12 cells into female transgenic lean and obese mice negative for the MMTV-TGFα transgene (n = 7 mice per group). B) Representative in vivo bioluminescent imaging of tumors performed 4 weeks after orthotopic/syngeneic allografting of EO771-FG12 cells into female a/a lean mice (n = 7), A y /a obese mice (n = 6), A y /a obese mice treated with metformin (300mg/kg daily; n = 6) and A y /a obese mice treated with everolimus (4mg/kg daily; n = 8). C) Representative images of syngeneic allografted tumors harvested from randomized lean, obese, metformin-treated, and everolimus-treated obese female mice (scale bars represent 5mm; left panel). A bar graph illustrates the mean tumor weights from the same experiment (n = 6–8 mice per group; right panel). Statistical significance was calculated by one-way analysis of variance. D) Phospho-protein levels of members of the AKT/mTOR signaling pathway from syngeneic allografted tumor lysates from obese mice plotted relative to those from lean mice (n = 5). E) Western blot analysis of total and phospho-AKT (Ser473), total and phospho-mTOR (Ser2448), and total and phospho-p70S6K (Thr389). Error bars in panels (B) and (D) represent 95% confidence intervals.
Figure 6.
Figure 6.
Effect of metformin and everolimus on serum adipokine levels in obese mice. A) Serum adipokines profile. Relative protein level presented as log ratio of integrated optical density of the microarray dot blot in the MMTV-TGFα;A y /a obese mouse pooled sera array relative to that in the MMTV-TGFα;a/a lean mouse pooled sera array is plotted (n = 3 mice per group composite) for each adipokine tested (left panel). Protein level presented as log ratio of integrated optical density of the microarray dot blot in the metformin-treated obese mouse pooled sera array relative to that in the untreated obese mouse pooled sera array is plotted (n = 3 mice per group composite) for each adipokine tested (right panel). B) Serum adipokines profile. Relative protein level presented as log ratio of integrated optical density of the microarray dot blot in the A y /a obese mouse pooled sera array relative to that in the a/a lean mouse pooled sera array is plotted (n = 3 mice per group composite) for each adipokine tested (left panel). Protein level presented as log ratio of integrated optical density of the microarray dot blot in the metformin-treated and everolimus-treated obese mouse pooled sera arrays relative to that in the untreated obese mouse pooled sera array is plotted (n = 3 mice per group composite) for each adipokine tested (right panel).
Figure 7.
Figure 7.
Effect of adipocytes on breast cancer cell proliferation and viability. A) MCF7 cell proliferation after having been cultured alone, in coculture with 3T3-L1 fibroblasts, or in coculture with 3T3-L1 mature adipocytes for 4 days. B) EO771 cell proliferation after having been cultured alone or in coculture with 3T3-L1 mature adipocytes for 3 days with high glucose Dulbecco’s modified Eagle medium and 10% bovine calf serum. C) Cell viability of T47D BC cells after incubation with undifferentiated 3T3-L1 pre-adipocyte-conditioned media or with differentiated 3T3-L1 mature adipocyte-conditioned media. D) MCF7 cell proliferation after metformin treatment cultured in coculture with 3T3-L1 mature adipocytes for 4 days. E) Adipokine profile array of conditioned media supernatants from 3T3-L1 mature adipocytes cultured for 24 hours relative to 3T3-L1 pre-adipocytes (n = 3 composite; left panel). Adipokines of conditioned media supernatants from 3T3-L1 mature adipocytes cultured with metformin for 24 hours relative to nontreated 3T3-L1 adipocytes (n = 3; right panel). Asterisks represent statistical significance (*P<.05, **P<.01, ***P<.001), one-way analysis of variance. F) MCF7 cell proliferation after being cocultured with 3T3-L1 mature adipocytes for 4 days alone or with TIMP-1 neutralizing antibody (2 μg/mL; R&D Systems). G) MCF7 cell proliferation after being cultured for 4 days alone or with human TIMP-1 (100ng/mL; Millipore, Billerica, MA). H) Representative photomicrographs of invasion assay of MCF7 cells, which were cultured for 4 days alone or with TIMP-1 (100ng/mL). Images were captured at ×4 magnification. Error bars in panels (AG) represent 95% confidence intervals (n ≥ 3). Statistical significances were calculated by one-way analysis of variance for panels (A) and (D) and by two-tailed t test for panels (C), (F), and (G).

Similar articles

Cited by

References

    1. Renehan AG, Tyson M, Egger M, et al. Body-mass index and incidence of cancer: a systematic review and meta-analysis of prospective observational studies. Lancet. 2008;371(9612):569–578 - PubMed
    1. La Vecchia C, Negri E, Franceschi S, et al. Body mass index and post-menopausal breast cancer: an age-specific analysis. Br J Cancer. 1997;75(3):441–444 - PMC - PubMed
    1. Petrelli JM, Calle EE, Rodriguez C, et al. Body mass index, height, and postmenopausal breast cancer mortality in a prospective cohort of US women. Cancer Causes Control. 2002;13(4):325–332 - PubMed
    1. Carmichael AR. Obesity as a risk factor for development and poor prognosis of breast cancer. BJOG. 2006;113(10):1160–1166 - PubMed
    1. Renehan AG, Soerjomataram I, Tyson M, et al. Incident cancer burden attributable to excess body mass index in 30 European countries. Int J Cancer. 2010;126(3):692–702 - PubMed

Publication types

MeSH terms