

Variable recombination dynamics during the emergence, transmission and 'disarming' of a multidrug-resistant pneumococcal clone
- PMID: 24957517
- PMCID: PMC4094930
- DOI: 10.1186/1741-7007-12-49
Variable recombination dynamics during the emergence, transmission and 'disarming' of a multidrug-resistant pneumococcal clone
Abstract
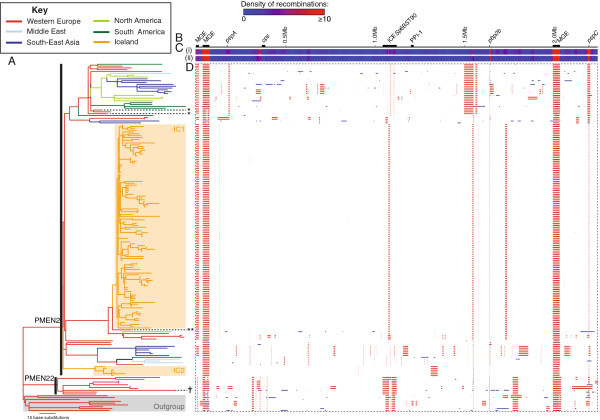
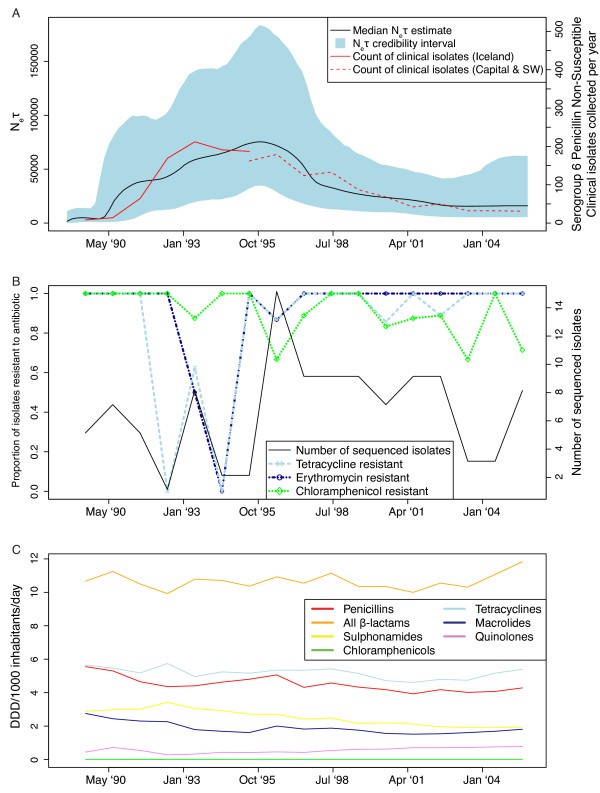
Background: Pneumococcal β-lactam resistance was first detected in Iceland in the late 1980s, and subsequently peaked at almost 25% of clinical isolates in the mid-1990s largely due to the spread of the internationally-disseminated multidrug-resistant PMEN2 (or Spain6B-2) clone of Streptococcus pneumoniae.
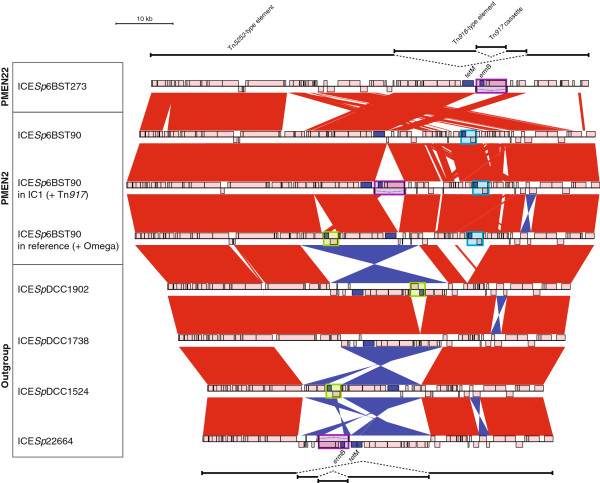
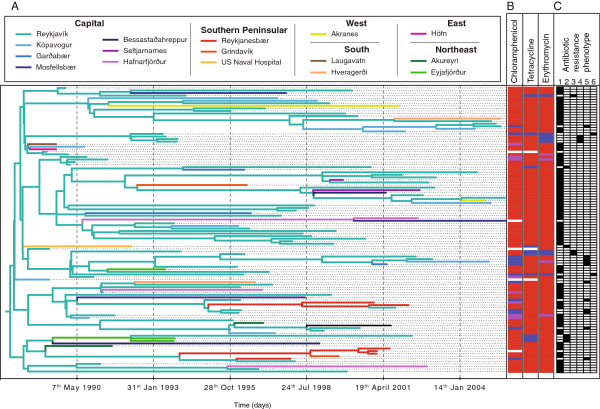
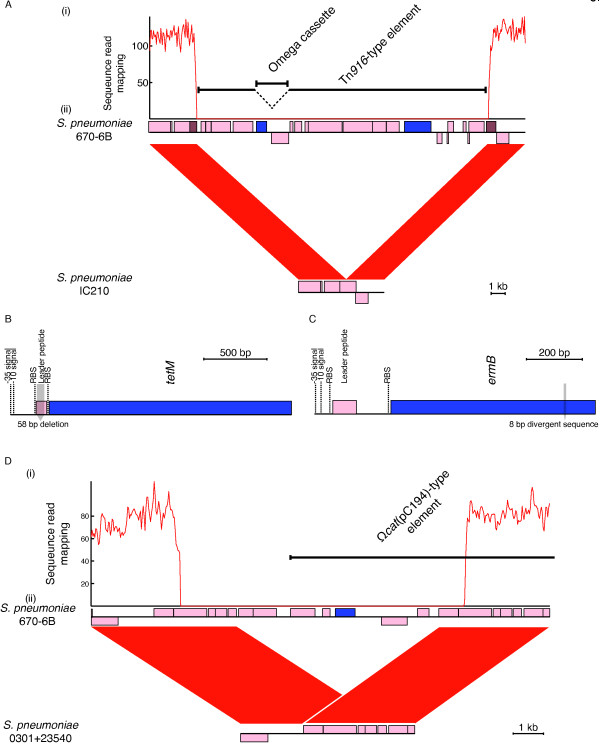
Results: Whole genome sequencing of an international collection of 189 isolates estimated that PMEN2 emerged around the late 1960s, developing resistance through multiple homologous recombinations and the acquisition of a Tn5253-type integrative and conjugative element (ICE). Two distinct clades entered Iceland in the 1980s, one of which had acquired a macrolide resistance cassette and was estimated to have risen sharply in its prevalence by coalescent analysis. Transmission within the island appeared to mainly emanate from Reykjavík and the Southern Peninsular, with evolution of the bacteria effectively clonal, mainly due to a prophage disrupting a gene necessary for genetic transformation in many isolates. A subsequent decline in PMEN2's prevalence in Iceland coincided with a nationwide campaign that reduced dispensing of antibiotics to children in an attempt to limit its spread. Specific mutations causing inactivation or loss of ICE-borne resistance genes were identified from the genome sequences of isolates that reverted to drug susceptible phenotypes around this time. Phylogenetic analysis revealed some of these occurred on multiple occasions in parallel, suggesting they may have been at least temporarily advantageous. However, alteration of 'core' sequences associated with resistance was precluded by the absence of any substantial homologous recombination events.
Conclusions: PMEN2's clonal evolution was successful over the short-term in a limited geographical region, but its inability to alter major antigens or 'core' gene sequences associated with resistance may have prevented persistence over longer timespans.
Figures
Similar articles
-
Molecular evolution in a multidrug-resistant lineage of Streptococcus pneumoniae: emergence of strains belonging to the serotype 6B Icelandic clone that lost antibiotic resistance traits.J Clin Microbiol. 2000 Apr;38(4):1375-81. doi: 10.1128/JCM.38.4.1375-1381.2000. J Clin Microbiol. 2000. PMID: 10747110 Free PMC article.
-
Population structure and drug resistance patterns of emerging non-PCV-13 Streptococcus pneumoniae serotypes 22F, 15A, and 8 isolated from adults in Ontario, Canada.Infect Genet Evol. 2016 Aug;42:1-8. doi: 10.1016/j.meegid.2016.04.007. Epub 2016 Apr 9. Infect Genet Evol. 2016. PMID: 27071529
-
Molecular epidemiology and variants of the multidrug-resistant Streptococcus pneumoniae Spain14-5 international clone among Spanish clinical isolates.J Antimicrob Chemother. 2006 Apr;57(4):654-60. doi: 10.1093/jac/dkl028. Epub 2006 Feb 16. J Antimicrob Chemother. 2006. PMID: 16484341
-
CIRCULATING CLONAL COMPLEXES AND SEQUENCE TYPES OF STREPTOCOCCUS PNEUMONIAE SEROTYPE 19A WORLDWIDE: THE IMPORTANCE OF MULTIDRUG RESISTANCE: A SYSTEMATIC LITERATURE REVIEW.Expert Rev Vaccines. 2021 Jan;20(1):45-57. doi: 10.1080/14760584.2021.1873136. Epub 2021 Feb 17. Expert Rev Vaccines. 2021. PMID: 33507135
-
Streptococcus pneumoniae: does antimicrobial resistance matter?Semin Respir Crit Care Med. 2009 Apr;30(2):210-38. doi: 10.1055/s-0029-1202939. Epub 2009 Mar 18. Semin Respir Crit Care Med. 2009. PMID: 19296420 Review.
Cited by
-
Towards routine employment of computational tools for antimicrobial resistance determination via high-throughput sequencing.Brief Bioinform. 2022 Mar 10;23(2):bbac020. doi: 10.1093/bib/bbac020. Brief Bioinform. 2022. PMID: 35212354 Free PMC article.
-
A comparison of various feature extraction and machine learning methods for antimicrobial resistance prediction in streptococcus pneumoniae.Front Antibiot. 2023 Mar 24;2:1126468. doi: 10.3389/frabi.2023.1126468. eCollection 2023. Front Antibiot. 2023. PMID: 39816648 Free PMC article.
-
Designing ecologically optimized pneumococcal vaccines using population genomics.Nat Microbiol. 2020 Mar;5(3):473-485. doi: 10.1038/s41564-019-0651-y. Epub 2020 Feb 3. Nat Microbiol. 2020. PMID: 32015499 Free PMC article.
-
Horizontal gene transfer rate is not the primary determinant of observed antibiotic resistance frequencies in Streptococcus pneumoniae.Sci Adv. 2020 May 20;6(21):eaaz6137. doi: 10.1126/sciadv.aaz6137. eCollection 2020 May. Sci Adv. 2020. PMID: 32671212 Free PMC article.
-
Efficient Inference of Recent and Ancestral Recombination within Bacterial Populations.Mol Biol Evol. 2017 May 1;34(5):1167-1182. doi: 10.1093/molbev/msx066. Mol Biol Evol. 2017. PMID: 28199698 Free PMC article.
References
-
- Klugman KP. The successful clone: the vector of dissemination of resistance inStreptococcus pneumoniae. J Antimicrob Chemother. 2002;12:1–5. - PubMed
-
- Jacobs MR, Koornhof HJ, Robins-Browne RM, Stevenson CM, Vermaak ZA, Freiman I, Miller GB, Witcomb MA, Isaacson M, Ward JI, Austrian R. Emergence of multiply resistant pneumococci. N Engl J Med. 1978;12:735–740. - PubMed
-
- Fenoll A, Martin Bourgon C, Munoz R, Vicioso D, Casal J. Serotype distribution and antimicrobial resistance ofStreptococcus pneumoniaeisolates causing systemic infections in Spain, 1979–1989. Rev Infect Dis. 1991;12:56–60. - PubMed
-
- Marton A, Gulyas M, Munoz R, Tomasz A. Extremely high incidence of antibiotic resistance in clinical isolates of Streptococcus pneumoniae in Hungary. J Infect Dis. 1991;12:542–548. - PubMed
-
- Kristinsson KG, Hjalmarsdottir MA, Steingrimsson O. Increasing penicillin resistance in pneumococci in Iceland. Lancet. 1992;12:1606. - PubMed
Publication types
MeSH terms
Grants and funding
LinkOut - more resources
Full Text Sources
Other Literature Sources
Medical
