. 2014 Sep;91(3):598-610.
doi: 10.4269/ajtmh.13-0303. Epub 2014 Jun 23.

Intra- and interseasonal autoregressive prediction of dengue outbreaks using local weather and regional climate for a tropical environment in Colombia

Intra- and interseasonal autoregressive prediction of dengue outbreaks using local weather and regional climate for a tropical environment in Colombia

Matthew D Eastin et al. Am J Trop Med Hyg. 2014 Sep.

Abstract

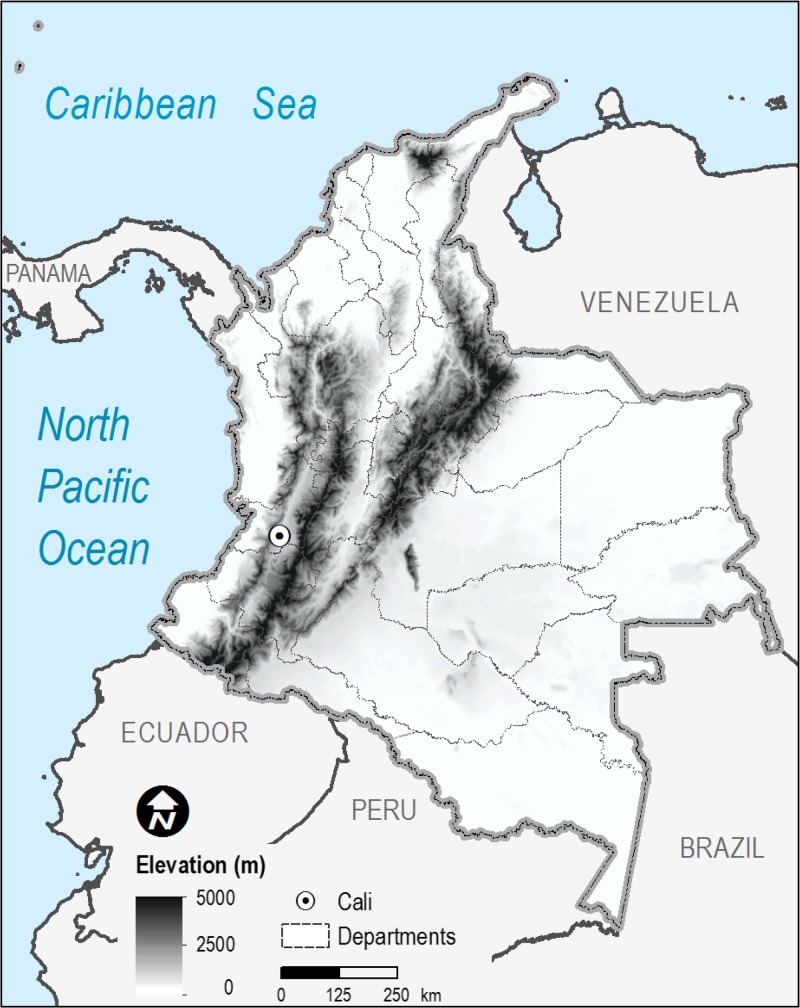
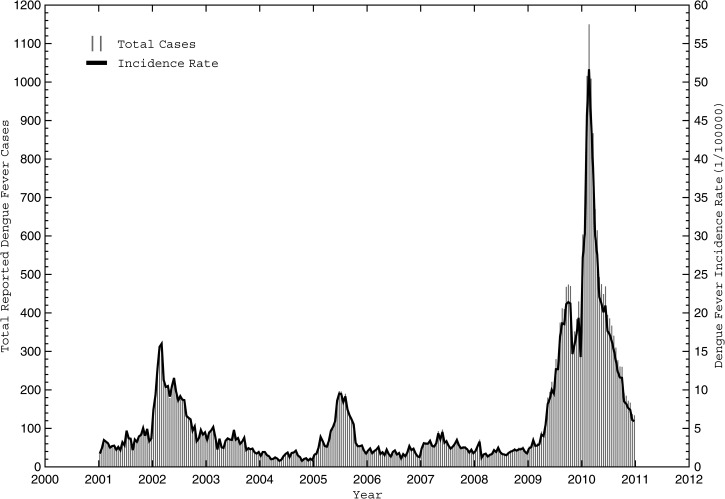
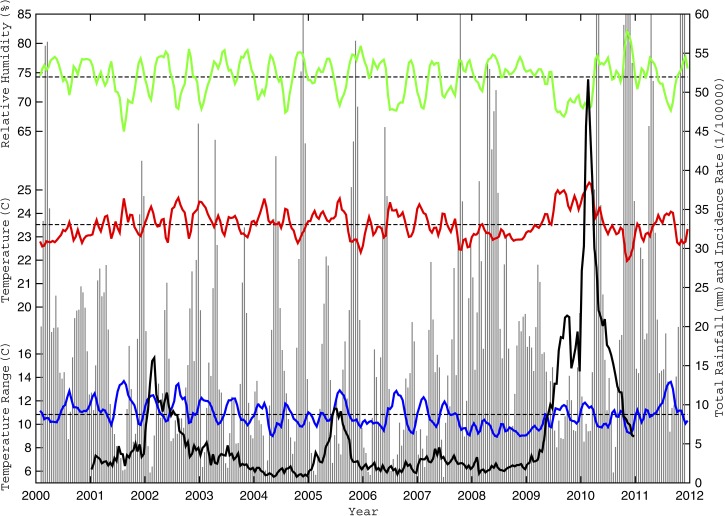
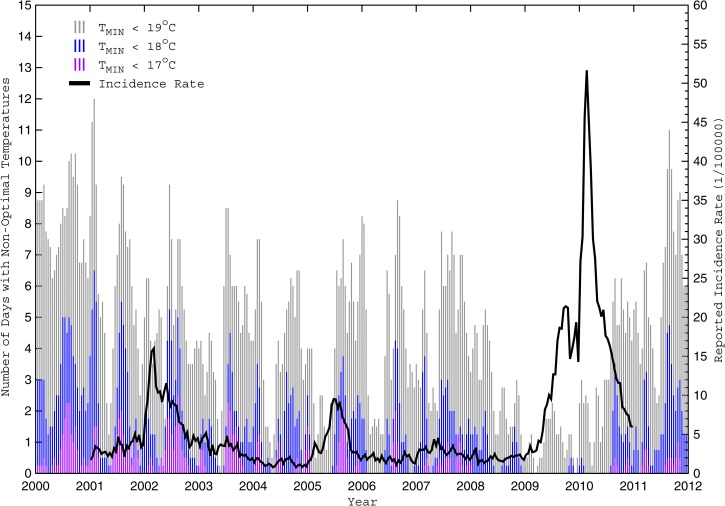
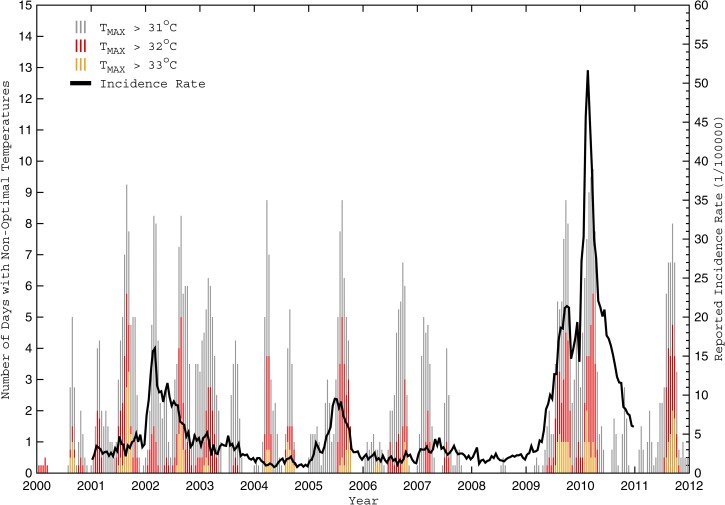
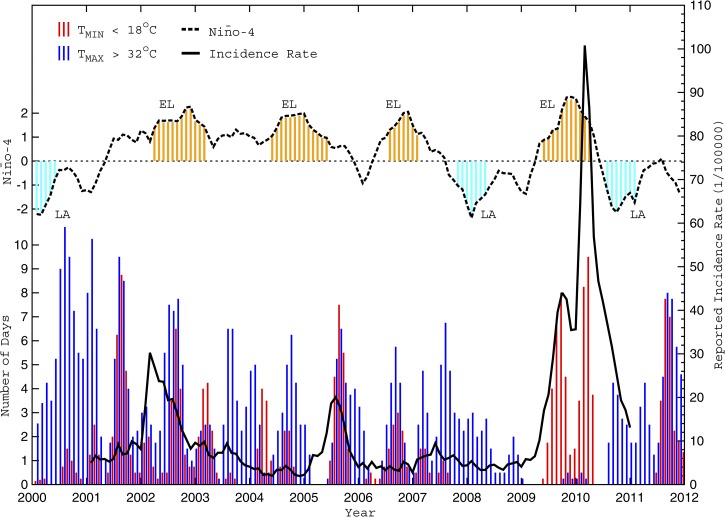
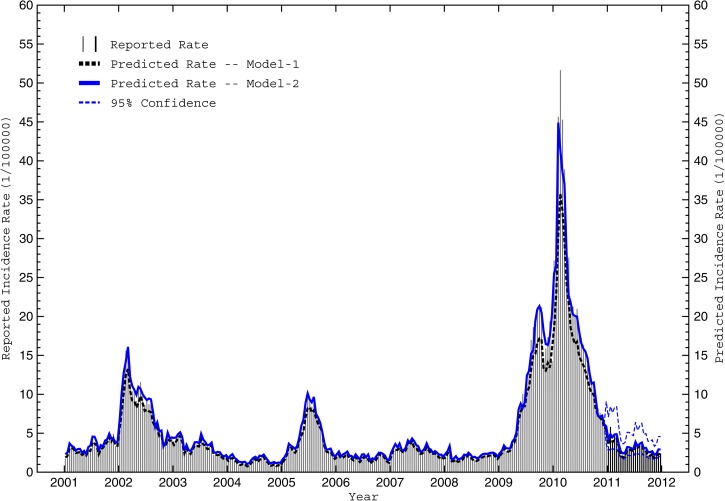
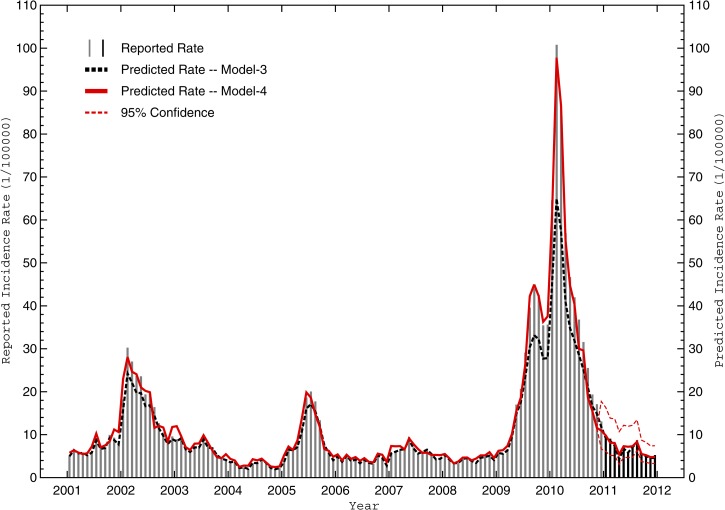
Dengue fever transmission results from complex interactions between the virus, human hosts, and mosquito vectors-all of which are influenced by environmental factors. Predictive models of dengue incidence rate, based on local weather and regional climate parameters, could benefit disease mitigation efforts. Time series of epidemiological and meteorological data for the urban environment of Cali, Colombia are analyzed from January of 2000 to December of 2011. Significant dengue outbreaks generally occur during warm-dry periods with extreme daily temperatures confined between 18°C and 32°C--the optimal range for mosquito survival and viral transmission. Two environment-based, multivariate, autoregressive forecast models are developed that allow dengue outbreaks to be anticipated from 2 weeks to 6 months in advance. These models have the potential to enhance existing dengue early warning systems, ultimately supporting public health decisions on the timing and scale of vector control efforts.


Figures

Figure 1.
Figure 1.
Topographical variation across Colombia, South America. The city of Cali is located within the tropical climate of the Cauca River Valley between two mountain ranges with peaks in excess of 4,000 m.
Figure 2.
Figure 2.
Reported biweekly dengue case totals and population-adjusted incidence rates from 2001 to 2010. Biweekly case totals (DTOT) are shown by vertical gray lines, and the population-adjusted incidence rates (DPOP) are depicted in black for Cali during the model development period between January of 2001 and December of 2010.
Figure 3.
Figure 3.
Observed biweekly weather variability and reported dengue incidence rates from 2000 to 2011. The biweekly mean temperature (TAVG), mean relative humidity (RHAVG), and mean daily temperature range (ΔTAVG) are shown in solid black, total rainfall (RRTOT) is shown by vertical gray lines, and the population-adjusted dengue fever incidence rate (DPOP) is shown in thick dashed black for Cali from January of 2000 to December of 2012. The thin dashed black horizontal lines denote the TAVG, ΔTAVG, and RHAVG long-term baseline means. Only dengue data during the model development period (2001–2010) are shown.
Figure 4.
Figure 4.
Number of days with non-optimal cold temperatures and reported biweekly dengue incidence rates from 2000 to 2011. The numbers of days during each biweekly period with a minimum temperature (TMIN) less than 19°C, 18°C, and 17°C are depicted by vertical light grey, medium grey, and dark grey lines, respectively, for Cali from January of 2000 to December of 2011. Note that a simple 1–2–1 filter was applied to the non-optimal daily counts for greater clarity. Also shown in black is the biweekly population-adjusted dengue fever incidence rate (DPOP) from 2001 to 2010.
Figure 5.
Figure 5.
Number of days with non-optimal warm temperatures and reported biweekly dengue incidence rates from 2000 to 2011. The numbers of days during each biweekly period with a maximum temperature (TMAX) greater than 31°C, 32°C, and 33°C are depicted by vertical grey, red, and orange lines, respectively, for Cali from January of 2000 to December of 2011. Note that a simple 1–2–1 filter was applied to the non-optimal daily counts for greater clarity. Also shown in black is the biweekly population-adjusted dengue fever incidence rate (DPOP) from 2001 to 2010.
Figure 6.
Figure 6.
Monthly time series of non-optimal days, ENSO, and dengue incidence rate from 2000 to 2011. The number of days each month with a maximum temperature (TMAX) greater than 32°C is shown by vertical light grey lines, whereas the number of days with a minimum temperature (TMIN) less than 18°C is depicted by vertical bark grey lines for Cali from January of 2000 to December of 2011. Note that a simple 1–2–1 filter was applied to the non-optimal daily counts for greater clarity. Also shown is population-adjusted dengue fever incidence rate (DPOP; solid black) and normalized N4 index (dashed black), where vertical dotted grey lines denote significant El Niño (EL) and La Niña (LA) events.
Figure 7.
Figure 7.
Reported and predicted intraseasonal dengue incidence rates from 2001 to 2011. The reported population-adjusted biweekly dengue incidence rates (DPOP) for Cali during the model development period (2001–2010) are shown by vertical grey lines, whereas reported rates during the model verification period (2011) are denoted by vertical black lines. Also shown are biweekly predictions by the best intraseasonal autoregressive model not using weather parameters (model 1; dashed black) and the best model using lagged weather parameters (model 2; solid blue) during both subperiods. The dashed blue lines denote the 95% confidence interval for model 2 during the verification period.
Figure 8.
Figure 8.
Reported and predicted interseasonal dengue incidence rates from 2001 to 2011. The reported population-adjusted monthly dengue incidence rates (DPOP) for Cali during the model development period (2001–2010) are shown by vertical light grey lines, whereas reported rates during the model verification period (2011) are denoted by vertical medium grey lines. Also shown are monthly predictions by the best interseasonal autoregressive model not using weather parameters (model 3; dashed dark grey) and the best model using lagged weather parameters (model 4; solid black) during both subperiods. The thin dashed black lines denote the 95% confidence interval for model 4 during the verification period.

Similar articles

Cited by

References

    1. World Health Organization Dengue and Severe Dengue. Fact Sheet No. 117. World Health Organization. 2012. http://www.who.int/mediacentre/factsheets/fs117/en/ Available at. Accessed March 20, 2013.
    1. Gubler DJ, Clark GG. Dengue/dengue hemorrhagic fever: the emergence of a global health problem. Emerg Infect Dis. 1995;1:55–57. - PMC - PubMed
    1. Ocampo CB, Salazar-Terreros MJ, Mina NJ, McAllister J, Brogdon W. Insecticide resistance status of Aedes aegypti in 10 localities in Colombia. Acta Trop. 2011;118:37–44. - PubMed
    1. Carbajo AE, Cardo MV, Vezzani D. Is temperature the main cause of dengue rise in non-endemic countries? The case of Argentina. Int J Health Geogr. 2012;11:1–11. - PMC - PubMed
    1. World Health Organization . Dengue: Guidelines for Diagnosis, Treatment, Prevention and Control—New Edition. Geneva: World Health Organization; 2009. - PubMed

Publication types