

The changing pace of insular life: 5000 years of microevolution in the Orkney vole (Microtus arvalis orcadensis)
- PMID: 24957579
- PMCID: PMC5366975
- DOI: 10.1111/evo.12476
The changing pace of insular life: 5000 years of microevolution in the Orkney vole (Microtus arvalis orcadensis)
Abstract
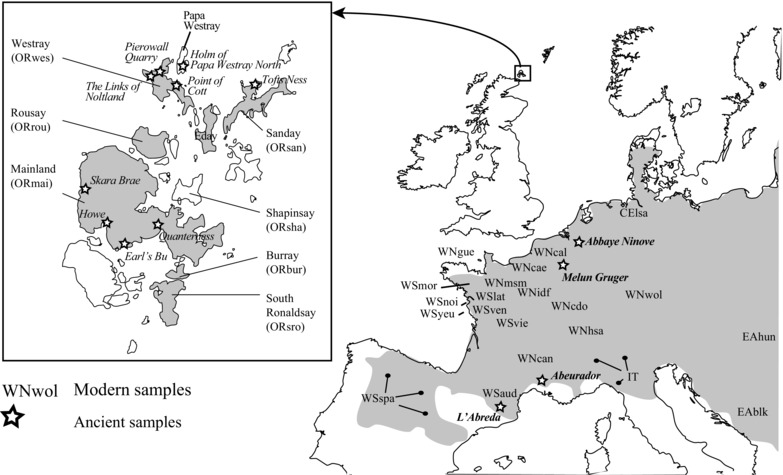
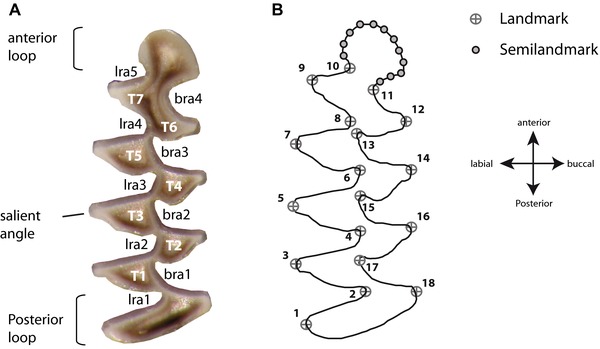
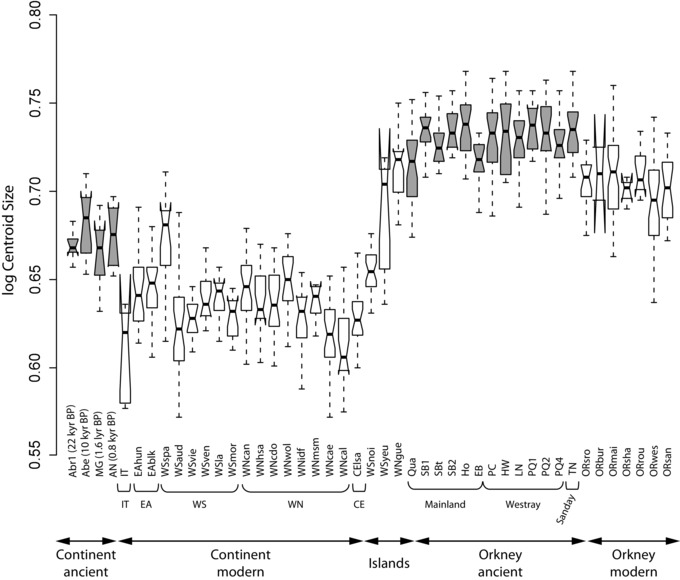
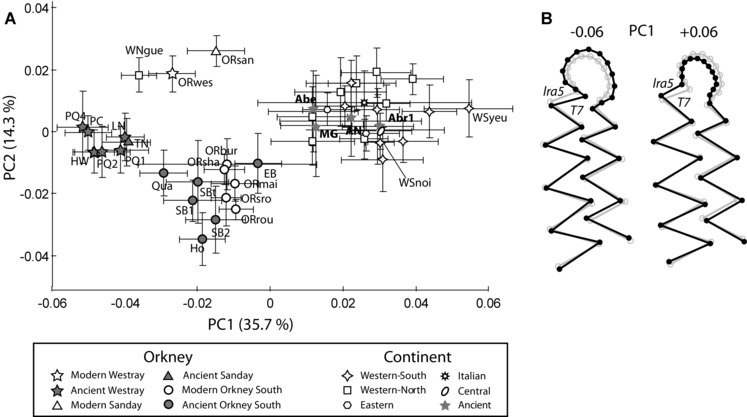
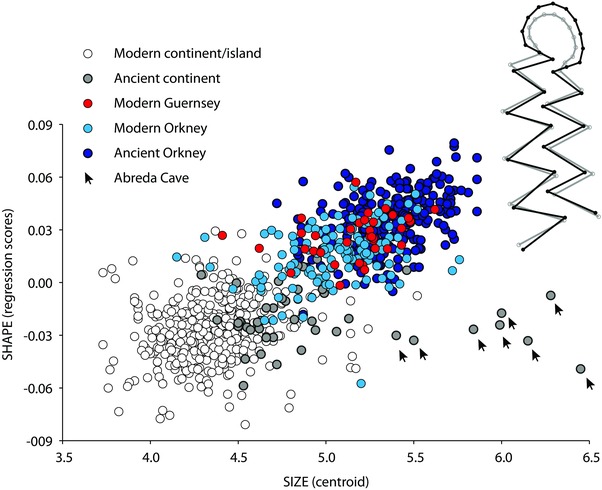
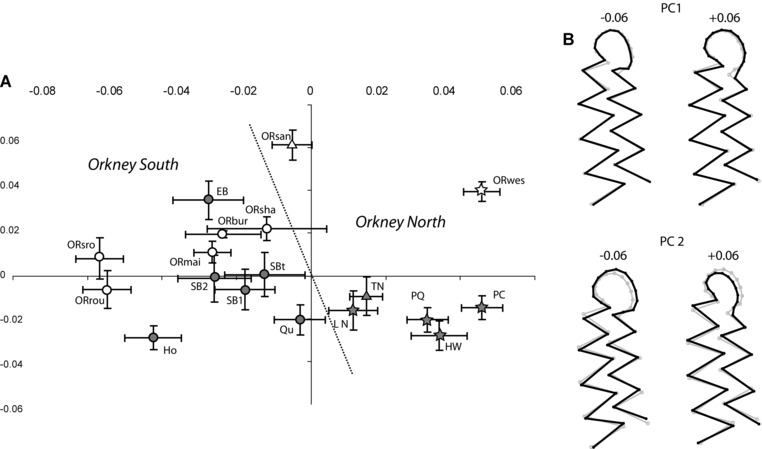
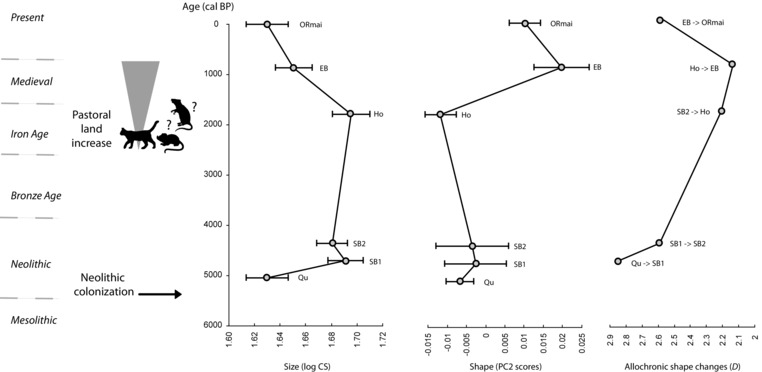
Island evolution may be expected to involve fast initial morphological divergence followed by stasis. We tested this model using the dental phenotype of modern and ancient common voles (Microtus arvalis), introduced onto the Orkney archipelago (Scotland) from continental Europe some 5000 years ago. First, we investigated phenotypic divergence of Orkney and continental European populations and assessed climatic influences. Second, phenotypic differentiation among Orkney populations was tested against geography, time, and neutral genetic patterns. Finally, we examined evolutionary change along a time series for the Orkney Mainland. Molar gigantism and anterior-lobe hypertrophy evolved rapidly in Orkney voles following introduction, without any transitional forms detected. Founder events and adaptation appear to explain this initial rapid evolution. Idiosyncrasy in dental features among different island populations of Orkney voles is also likely the result of local founder events following Neolithic translocation around the archipelago. However, against our initial expectations, a second marked phenotypic shift occurred between the 4th and 12th centuries AD, associated with increased pastoral farming and introduction of competitors (mice and rats) and terrestrial predators (foxes and cats). These results indicate that human agency can generate a more complex pattern of morphological evolution than might be expected in island rodents.
Keywords: Dispersal; evolutionary rate; geometric morphometrics; island evolution; tooth shape; zooarchaeology.
© 2014 The Authors. Evolution published by Wiley Periodicals, Inc. on behalf of The Society for the Study of Evolution.
Figures
References
-
- Adams, D. C. 2014. Quantifying and comparing phylogenetic evolutionary rates for shape and other high‐dimensional phenotypic data. Syst. Biol. 63:166–177. - PubMed
-
- Adams, D. C. , Rohlf F. J., and Slice D. E.. 2013. A field comes of age: geometric morphometrics in the 21st century. Hystrix 24:7–14.
-
- Adler, G. H. , and Levins R.. 1994. The island syndrome in rodent populations. Q. Rev. Biol. 69:473–490. - PubMed
-
- Arnegard, M. E. , McIntyre P. B., Harmon L. J., Zelditch M. L., Crampton W. G. R., Davis J. K., Sullivan J. P., Lavoué S., and Hopkins C. D.. 2010. Sexual signal evolution outpaces ecological divergence during electric fish species radiation. Am. Nat. 176:335–356. - PubMed
-
- Ballin Smith, B . 1994. Howe. Four millenia of Orkney prehistory. Society of Antiquaries of Scotland, Edinburgh.
Publication types
MeSH terms
Grants and funding
LinkOut - more resources
Full Text Sources
Other Literature Sources
Miscellaneous