. 2014 Jun 23:11:48.
doi: 10.1186/1742-4690-11-48.

Distinct HIV-1 entry phenotypes are associated with transmission, subtype specificity, and resistance to broadly neutralizing antibodies

Affiliations

Distinct HIV-1 entry phenotypes are associated with transmission, subtype specificity, and resistance to broadly neutralizing antibodies

Kelechi Chikere et al. Retrovirology. .

Abstract

Background: The efficiency of CD4/CCR5 mediated HIV-1 entry has important implications for pathogenesis and transmission. The HIV-1 receptor affinity profiling (Affinofile) system analyzes and quantifies the infectivity of HIV-1 envelopes (Envs) across a spectrum of CD4/CCR5 expression levels and distills these data into a set of Affinofile metrics. The Affinofile system has shed light on how differential CD4/CCR5 usage efficiencies contributes to an array of Env phenotypes associated with cellular tropism, viral pathogenesis, and CCR5 inhibitor resistance. To facilitate more rapid, convenient, and robust analysis of HIV-1 entry phenotypes, we engineered a reporter Affinofile system containing a Tat- and Rev-dependent Gaussia luciferase-eGFP-Reporter (GGR) that is compatible with the use of pseudotyped or replication competent viruses with or without a virally encoded reporter gene. This GGR Affinofile system enabled a higher throughput characterization of CD4/CCR5 usage efficiencies associated with differential Env phenotypes.

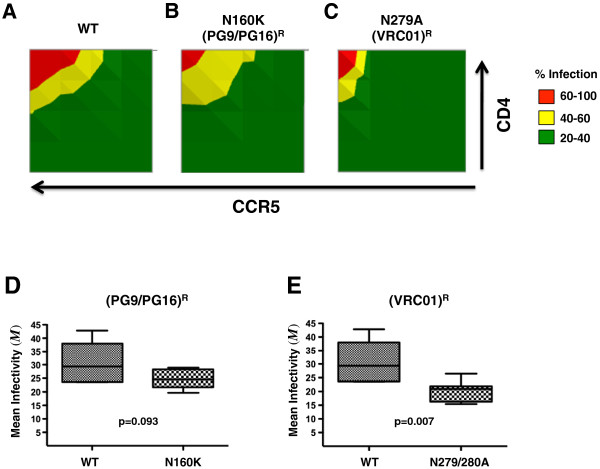
Results: We first validated our GGR Affinofile system on isogenic JR-CSF Env mutants that differ in their affinity for CD4 and/or CCR5. We established that their GGR Affinofile metrics reflected their differential entry phenotypes on primary PBMCs and CD4+ T-cell subsets. We then applied GGR Affinofile profiling to reveal distinct entry phenotypes associated with transmission, subtype specificity, and resistance to broadly neutralizing antibodies (BNAbs). First, we profiled a panel of reference subtype B transmitted/founder (T/F) and chronic Envs (n = 12) by analyzing the infectivity of each Env across 25 distinct combinations of CD4/CCR5 expression levels. Affinofile metrics revealed that at low CCR5 levels, our panel of subtype B T/F Envs was more dependent on high levels of CD4 for HIV-1 entry compared to chronic Envs. Next, we analyzed a reference panel of 28 acute/early subtype A-D Envs, and noted that subtype C Envs could be distinguished from the other subtypes based on their infectivity profiles and relevant Affinofile metrics. Lastly, mutations known to confer resistance to VRC01 or PG6/PG19 BNAbs, when engineered into subtypes A-D Envs, resulted in significantly decreased CD4/CCR5 usage efficiency.

Conclusions: GGR Affinofile profiling reveals pathophysiological phenotypes associated with varying HIV-1 entry efficiencies, and highlight the fitness costs associated with resistance to some broadly neutralizing antibodies.


Figures

Figure 1
Figure 1
Generation and characterization of the GGR Affinofile Cell Line. (A) Schema of the tat-rev dependent Gaussia luciferase (gLuc)-IRES-GFP reporter vector as described in the text. (B) and (C) GGR cells were maximally induced with doxycyline (Doxy, 4ng/ml) and ponasterone A (PonA, 4 μM) at the time of their seeding in 96-well plates. 16–21 hours post-seeding/induction, cells were infected with wt JR-CSF virus at varying multiplicities of infection (MOI). The titer of the virus was previously determined on stable CD4/CCR5-expressing GHOST cells where CD4/CCR5 levels are non-limiting. At 17, 24, 48, and 72 hpi, 10 μL (out of 150) of the infected cell supernatant was removed and analyzed for gLuc activity as per manufacturer’s instructions. Luciferase activity (measured as relative light units, RLU), and the corresponding signal:noise ratios at each data point are shown in (B) and (C), respectively. Mock-infected cell supernatant served as the background signal. (D) and (E) GGR cells were induced at high (3.2ng/mL Doxy, 2 μM PonA), medium (1.6ng/mL Doxy, 1μm PonA), and low (0.4ng/mL Doxy, 0.25μM PonA) levels, and infected as above with pseudotyped virus at an MOI of 0.25. Three days post-infection, supernatant was collected and analyzed for gluc expression (E), while cells from each well were individually processed for intracellular p24 staining (D) as described in methods. Data shown is representative of two independent experiments.
Figure 2
Figure 2
Defining the limiting parameters of sensitivity vector metrics used for profiling HIV-1 entry efficiency. (A) Infectivity of a primary subtype B R5-virus monitored across 25 distinct combinations of CD4 and CCR5 expression levels. The normalized infectivity profile is shown as a 3-D bar graph with the luciferase activity obtained at the highest CD4 and CCR5 induction level set at 100%. (B-C) The surface function F(x, y) is used to fit the infectivity data as previously described [34]. The resulting 3-D surface plot can be represented by three metrics that reflect distinct phenotypic properties of the infecting virus envelope: (B) the mean infectivity level (M), and (C) the angle (θ) and amplitude (Δ) of the sensitivity vector S that describes the envelope’s response to varying levels of CD4 and CCR5. For clarity, the operational definitions of these metrics, and what they measure with respect to the infectious phenotype of Env, are also indicated. Note that while we have changed the nomenclature of these Affinofile metrics to more intuitively reflect the Env properties they are intended to describe, the fundamental definitions are the same as in Johnston et al. (Ref [34]). Thus, “mean induction” is now termed “mean infectivity”, and vector “magnitude” is now termed vector “amplitude”.
Figure 3
Figure 3
Sensitivity vector metrics further illuminate the phenotype of well-characterized point mutants. (A) Infectivity profile of wt JR-CSF (R5) envelope, and three point mutants: (B) S142N, (C) E153G and (D) K421D, previously shown to enhance or perturb CCR5 or CD4 usage with polar plots (beneath) representing the metrics obtained from mathematical analysis of the infectivity profiles (A-C). The vector angle (θ) is the angle between the x-axis and the dotted line. The vector amplitude (Δ) is represented by the length of the dotted line. The mean infectivity (M) is represented by the size of the circle. Data shown is a representative of two experiments. (E) Table of the average Affinofile metrics obtained from (A-D) and graphically shown in polar plots beneath (A-D). Boxes next to (E) describe the phenotypes indicated by each metric relative to wt JR-CSF. The infectivity profile of each Env was independently repeated twice.
Figure 4
Figure 4
Sensitivity vector metrics reflect biologically relevant differences in T cell subset tropism. (A) Total PBMCs were infected with luciferase reporter pseudotypes bearing wt, S142N, or K421D JR-CSF envelopes. VSV-G pseudotypes were used as positive controls. All infections (except for VSV-G) could be inhibited by maraviroc (>95%). Error bars represent ranges between two experiments. (B) Scheme for using CCR7 (PE-Cy7) and CD45RO (FITC) to identify the following T-cell subsets: Naïve (CCR7+ CD45RO-), Central Memory (TCM, CCR7+ CD45RO+), Effector Memory (TEM, CCR7- CD45RO+), and Effector Memory RA (TEMRA, CCR7- CD45RO-). (C) and (D) CD8-depleted PBMCs were infected with the indicated pseudotyped viruses at an MOI of 20 (as titered on Ghost-R5 cells). Three days post-infection, cells were analyzed by multi-color flow cytometry. (C) Infected cells were identified by intracellular p24 staining using PE-conjugated KC57 Mab. (D) Uninfected T-cell subset distribution is shown in grey density plot, while infected p24+ cells are overlaid as the red dots. The percent of total p24+ cells are indicated in each quadrant. All infections could be inhibited by maraviroc (>90%). Data shown here is a representative of two independent donors.
Figure 5
Figure 5
Sensitivity vector metrics reveal differences in CD4/CCR5 usage efficiencies between Transmitter/Founder (T/F) and chronic envelopes. Normalized infection data using T/F and chronic Env clones were analyzed using VERSA. (A) Vector angle, (θ), (B) mean infectivity (M), and (C) vector amplitude (Δ) values were obtained for each Env clone. Each Env was profiled twice, in triplicate, across 25 combinations of CD4/CCR5 expression. Average metrics of 6 individuals from each group (T/F or chronic, N=12) are shown, each group consisting of 900 data points. The median value of each metric for the T/F and chronic Env cohorts is marked by a line. p values were generated by the non- parametric unpaired t test (***p = 0.0003; *p = 0.05). (D and E) The normalized infectivity for the chronic (blue line) and T/F envelopes (red line) are averaged, and compared as a group at (D) low and (E) high levels of CCR5 expression, across varying levels of CD4 as indicated. (F) Wedge plot of the average angle and amplitude (+/- S.D.) obtained for T/F (dark grey) versus chronic envelopes (light grey). (G) The infectivity profile of individual T/F and chronic Envs (from Additional file 5: Figure S3) were averaged to form their respective group profile. 2-D contour plots representing the averaged infectivity profiles of T/F and chronic envelopes are shown. (H) T/F Envs and macrophage tropic (YU2, ADA) and non-macrophage tropic (JRCSF) R5 Envs were used to produce Env pseudotyped luciferase reporter viruses, which were subsequently titrated on JC53 cells. Monocyte derived macrophages were inoculated with equivalent infectious units of each reporter virus, and luciferase activity measured in cell lysates at 72hrs post infection. Results of infection in 3 independent donors are shown. Results are means of triplicate wells, and error bars represent standard deviations.
Figure 6
Figure 6
HIV envelopes exhibit subtype-specific differences in CD4/CCR5 usage efficiencies. (A) Normalized infection data from each subtype A, B, C and D envelope clones (n = 28) were analyzed by VERSA. The vector metrics were averaged for at least two independent infections (with a variance <5%) for each envelope in each subtype group. Vector angle (θ), mean infectivity (M), and vector amplitude (Δ) values for each envelope are shown as grouped by subtypes. P values were generated by the non- parametric unpaired t test (p*** < 0.005, **p < 0.05). B) 2-D contour plots of the average infectivity profile for each subtype, generated and color coded as in Figure  4G. The colored dashed square boxes compare the infectivity differences noted between subtype C (blue) Envs and others (red) in the lower left (LL) and upper right (UR) quadrants. Each Env clone was independently profiled twice. (C) Polar plot of the averaged sensitivity vectors obtained from each subtype, generated as in Figure  3E.
Figure 7
Figure 7
Affinofile profiling reveals that resistance to broadly neutralizing antibodies (BNAbs) also results in reduced entry efficiency. (A-C) N160K and N279/280A mutations were engineered into a random sample of 12 subtype A-D Envs. The resultant (PG9/PG16)R and (VRC01)R resistant Envs were assayed for CD4 and CCR5 usage efficiency along with their parental BNAb sensitive Envs. GGR Affinofile profiling was performed as previously described. 2-D contour plots of the averaged infectivity profiles for (A) WT, (B) (PG9/PG16)R, and (C) (VRC01)R Envs are shown. The infectivity profile for the individual Envs are shown in supplementary Figure S5. Axes and color-codes are identical to previous contour plots. (D-E) The median values and interquartile ranges of the Mean infectivity (M) are shown for (PG9/PG16)R or (VRC01)R resistant Envs compared to their WT counterparts. P values calculated via a non-parametric paired t-test.

References

    1. Wilen CB, Tilton JC, Doms RW. Molecular mechanisms of HIV entry. Adv Exp Med Biol. 2012;726:223–242. - PubMed
    1. Connor RI, Sheridan KE, Ceradini D, Choe S, Landau NR. Change in coreceptor use correlates with disease progression in HIV-1–infected individuals. J Exp Med. 1997;185:621–628. - PMC - PubMed
    1. Bjorndal A, Deng H, Jansson M, Fiore JR, Colognesi C, Karlsson A, Albert J, Scarlatti G, Littman DR, Fenyo EM. Coreceptor usage of primary human immunodeficiency virus type 1 isolates varies according to biological phenotype. J Virol. 1997;71:7478–7487. - PMC - PubMed
    1. Spira S, Wainberg M, Loemba H, Turner D, Brenner B. Impact of clade diversity on HIV-1 virulence, antiretroviral drug sensitivity and drug resistance. J Antimicrob Chemoth. 2003;51:229–240. - PubMed
    1. Gorry PR, Ancuta P. Coreceptors and HIV-1 Pathogenesis. Curr HIV/AIDS Rep. 2010;8:45–53. - PubMed

Publication types