. 2014 Jun 24:4:5228.
doi: 10.1038/srep05228.

CCL2 enhances pluripotency of human induced pluripotent stem cells by activating hypoxia related genes

Collaborators, Affiliations

CCL2 enhances pluripotency of human induced pluripotent stem cells by activating hypoxia related genes

Yuki Hasegawa et al. Sci Rep. .

Erratum in

  • Sci Rep. 2014;4:6385

Abstract

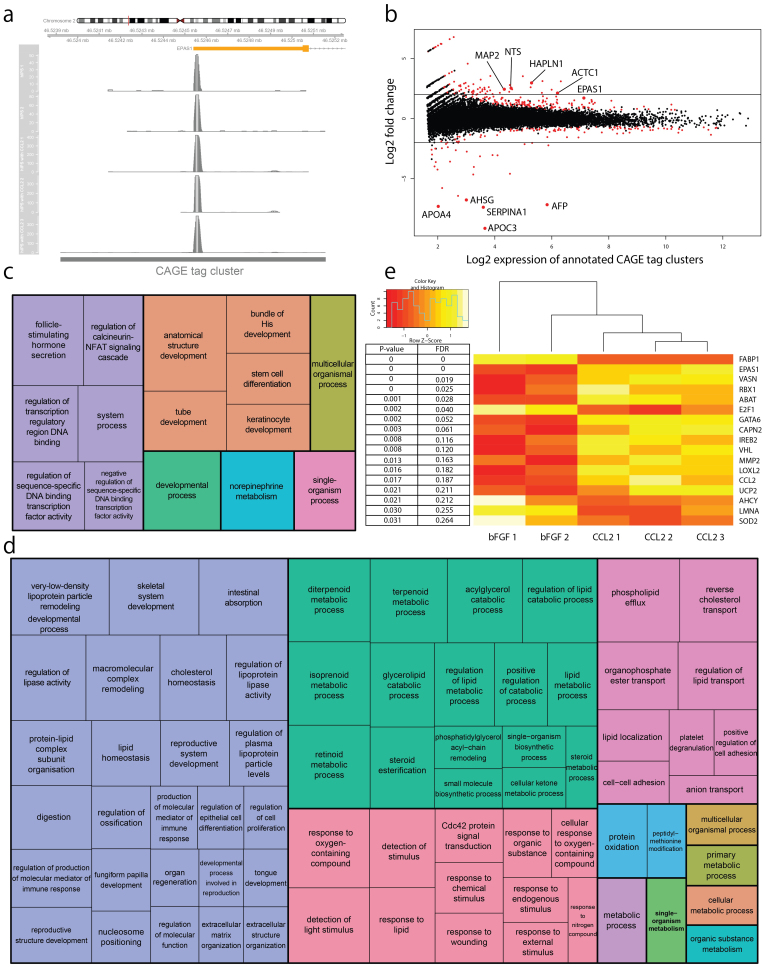
Standard culture of human induced pluripotent stem cells (hiPSCs) requires basic Fibroblast Growth Factor (bFGF) to maintain the pluripotent state, whereas hiPSC more closely resemble epiblast stem cells than true naïve state ES which requires LIF to maintain pluripotency. Here we show that chemokine (C-C motif) ligand 2 (CCL2) enhances the expression of pluripotent marker genes through the phosphorylation of the signal transducer and activator of transcription 3 (STAT3) protein. Moreover, comparison of transcriptomes between hiPSCs cultured with CCL2 versus with bFGF, we found that CCL2 activates hypoxia related genes, suggesting that CCL2 enhanced pluripotency by inducing a hypoxic-like response.Further, we show that hiPSCs cultured with CCL2 can differentiate at a higher efficiency than culturing withjust bFGF and we show CCL2 can be used in feeder-free conditions [corrected]. Taken together, our finding indicates the novel functions of CCL2 in enhancing its pluripotency in hiPSCs.


Figures

Figure 1
Figure 1. CCL2 enhances the expression of pluripotent genes via the phosphorylation of STAT3.
(a): Signal pathway diagrams for mouse ES/iPSCs and human ES/iPSCs. (b): Quantitative RT-PCR of four key pluripotent genes in human iPSC cultured with bFGF (white bars) and with CCL2 (black bars). Asterisks (*) denote significant p-values (Student's t-test indicate, p-value < 0.05) and error bars denote standard deviations n = 3. (c): Quantitative RT-PCR for pluripotent marker genes on human iPSCs cultured with bFGF, CCL2 without bFGF and without bFGF and LIF. Asterisks (*) denote significant p-values (Student's t-test indicate, p-value < 0.05) and error bars indicate standard deviations for n = 3. All primer sequences used in this study are listed in Supplementary Table S8. (d): Immuno-blots of whole cell extracts from CCL2 or bFGF cultured human iPSCs were subjected to immuno-blotting against antibodies for STAT3, phosphorylated STAT3, and GAPDH(left). Ratio of phosphorylated/total STAT3 estimated from the immune-blots. Full length gels and blots are included in the supplementary information (Supplementary Fig. S2). P-values using Student's t-test indicate a highly significant difference (p-value < 0.01, n = 3) in STAT3 phosphorylation levels between bFGF and CCL2 conditions (right). (e): Quantitative RT-PCR for Smad4 on human iPSCs cultured on feeder cells with adding either bFGF or CCL2 together with and without LIF. Error bars indicate standard deviations for n = 3.
Figure 2
Figure 2. Cap Analysis Gene Expression reveals the up-regulation of hypoxia related genes and the down-regulation of genes associated with lipids and lipoproteins.
(a): A genome browser representation of CAGE reads from 5 different libraries mapping mainly to the 5′ end of the EPAS1 gene. The red line at the chromosome ideogram shows the current position and the scale displays the chromosome coordinates. A CAGE tag cluster is formed by aggregating CAGE reads that lie in close proximity to each other. (b): MA plot showing the expression differences between bFGF and CCL2 CAGE libraries. On the x-axis is the expression strength of a gene (on log2 scale) and on the y-axis is the fold change between the two conditions. A positive fold change indicates an up-regulated gene in the CCL2 library and a negative fold change indicates down-regulation. Red dots indicate genes that are differentially expressed between the two conditions with statistical significance. Genes related to lipid metabolism are down-regulated and genes related to cell adhesion and hypoxia are up-regulated. The black lines indicate a fold change of +/− 2. (c and d): Enriched gene ontology terms are displayed as TreeMaps, where each rectangle is a single cluster representative of closely related gene ontology (GO) terms. These representatives are further grouped into “superclusters” of loosely related terms and have the same arbitrarily chosen color. (c) The list of GO terms over-represented in the list of up-regulated genes and (d) the list of GO terms over-represented in the list of down-regulated genes in the CCL2 libraries. (e): Heatmap showing the expression strength of 17 hypoxia related genes ranked by the p-value and subsequent false discovery rate calculated by the differential gene expression analysis. Each row shows the normalized expression pattern (Z-Score) for that particular gene in the 2 bFGF and 3 CCL2 CAGE libraries.
Figure 3
Figure 3. CCL2 reactivates X chromosome and enhances differentiation ability.
(a): Quantitative RT-PCR of XIST and TSIX genes in human iPSC cultured with bFGF (white bars) and with CCL2 (black bars). Asterisks (*) denote significant p-values (Student's t-test p-value < 0.05) and error bars denote standard deviations for n = 3. (b): Quantitative RT-PCR on additional X-linked genes related to X chromosome inactivation on bFGF_hiPSCs and CCL2_hiPSCs. Asterisks (*) denote significant p-values (Student's t-test p-value < 0.05) and error bars indicate standard deviations for n = 3. (c): Quantitative RT-PCR on human iPSC cultured with bFGF (white bars) and with CCL2 (black bars) for a panel of genes related to cell adhesion. Asterisks (*) denote significant p-values (Student's t-test p-value < 0.05) and error bars indicate standard deviations for n = 3. (d): The number of EBs formed from same cell numbers of human iPSC cultured with bFGF (white bars) and with CCL2 (black bars). Asterisks (*) denote significant p-values (Student's t-test p-value < 0.05) and error bars indicate standard deviations for n = 3. (d): Immunostaining and flow cytometry analysis with a cardiomyocyte marker, Desmin (i), and a neuronal marker, Nestin (ii) and on spontaneously differentiated embryoid bodies derived from iPSC cultured with bFGF and with CCL2. The red color represents both Desmin and Nestin and blue represents nuclei staining. The lower panels show FACS analysis on Desmin positive cells and Nestin positive cells of human iPSCs cultured with bFGF and with CCL2. Plotted graphs for replicate data of FACS analysis are shown in Supplementary Figure S4.
Figure 4
Figure 4. Feeder-free culturing of human iPSCs with CCL2 and LIF maintains pluripotency.
(a): Diagram of protein beads: Schematic representation of the preparation of CCL2 polyhedra. The immobilization signal derived from the VP3 region of the Bombyx mori cytoplasmic polyhedrosis virus (BmCPV) was introduced at the C terminus of CCL2. The fusion protein is then co-expressed with BmCPV polyhedrin and incorporated into the resulting polyhedral, which is coated on a dish together with gelatin solution. (b): Fluorescence images of immunostained human iPSCs cultured on CCL2 and LIF protein beads coated dish: Cells stained with TRA1-60 (green) (i) and SSEA4 (red) (ii). The bright field image of cells cultured on CCL2 protein beads only, LIF beads only, and Gelatin solution only showed that the cells were unable to attach or failed to maintain pluripotency (iii). (c): Quantitative RT-PCR was performed on a range of pluripotency genes on bFGF_hiPSCs with feeder cells (black bars) and CCL2_iPSCs cultured without feeder cells (white bars).

References

    1. Takahashi K. & Yamanaka S. Induction of pluripotent stem cells from mouse embryonic and adult fibroblast cultures by defined factors. Cell 126, 663–676, 10.1016/j.cell.2006.07.024 (2006). - PubMed
    1. Takahashi K. et al. Induction of pluripotent stem cells from adult human fibroblasts by defined factors. Cell 131, 861–872, 10.1016/j.cell.2007.11.019 (2007). - PubMed
    1. Yu J. et al. Induced pluripotent stem cell lines derived from human somatic cells. Science 318, 1917–1920, 10.1126/science.1151526 (2007). - PubMed
    1. Nichols J. & Smith A. Naive and primed pluripotent states. Cell Stem Cell 4, 487–492, 10.1016/j.stem.2009.05.015 (2009). - PubMed
    1. Chin M. H. et al. Induced pluripotent stem cells and embryonic stem cells are distinguished by gene expression signatures. Cell Stem Cell 5, 111–123, 10.1016/j.stem.2009.06.008 (2009). - PMC - PubMed

Publication types

MeSH terms