

Monitoring the effects of dexamethasone treatment by MRI using in vivo iron oxide nanoparticle-labeled macrophages
- PMID: 24957862
- PMCID: PMC4095600
- DOI: 10.1186/ar4588
Monitoring the effects of dexamethasone treatment by MRI using in vivo iron oxide nanoparticle-labeled macrophages
Abstract
Introduction: Rheumatoid arthritis (RA) is a chronic disease causing recurring inflammatory joint attacks. These attacks are characterized by macrophage infiltration contributing to joint destruction. Studies have shown that RA treatment efficacy is correlated to synovial macrophage number. The aim of this study was to experimentally validate the use of in vivo superparamagnetic iron oxide nanoparticle (SPION) labeled macrophages to evaluate RA treatment by MRI.
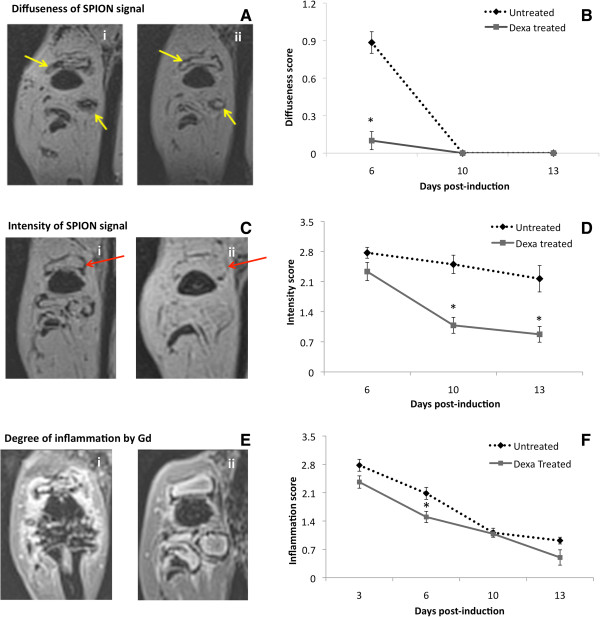
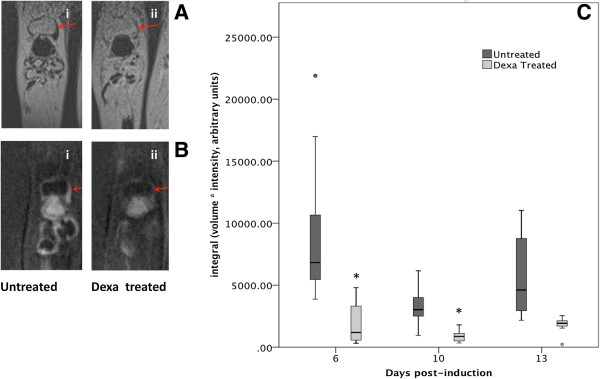
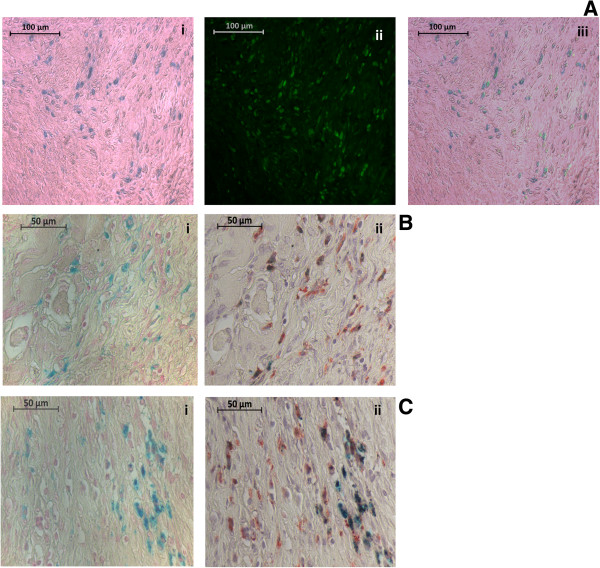
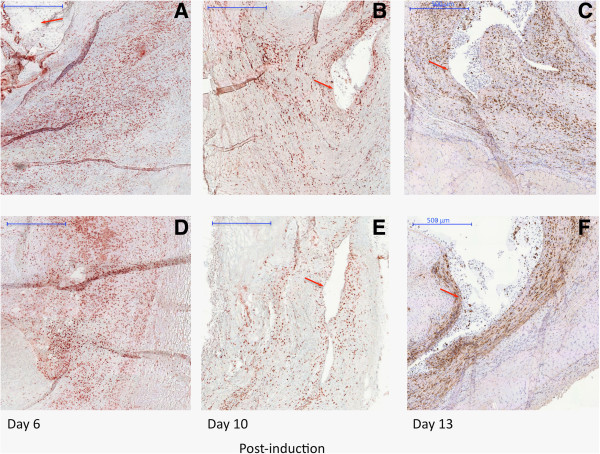
Methods: The evolution of macrophages was monitored with and without dexamethasone (Dexa) treatment in rats. Two doses of 3 and 1 mg/kg Dexa were administered two and five days following induction of antigen induced arthritis. SPIONs (7 mg Fe/rat) were injected intravenously and the knees were imaged in vivo on days 6, 10 and 13. The MR images were scored for three parameters: SPION signal intensity, SPION distribution pattern and synovial oedema. Using 3D semi-automated software, the MR SPION signal was quantified. The efficacy of SPIONs and gadolinium chelate (Gd), an MR contrast agent, in illustrating treatment effects were compared. Those results were confirmed through histological measurements of number and area of macrophages and nanoparticle clusters using CD68 immunostaining and Prussian blue staining respectively.
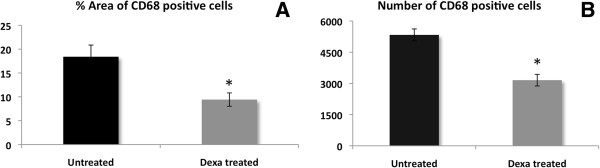
Results: Results show that the pattern and the intensity of SPION-labeled macrophages on MRI were altered by Dexa treatment. While the Dexa group had a uniform elliptical line surrounding an oedema pocket, the untreated group showed a diffused SPION distribution on day 6 post-induction. Dexa reduced the intensity of SPION signal 50-60% on days 10 and 13 compared to controls (P = 0.00008 and 0.002 respectively). Similar results were found when the signal was measured by the 3D tool. On day 13, the persisting low grade arthritis progression could not be demonstrated by Gd. Analysis of knee samples by Prussian blue and CD68 immunostaining confirmed in vivo SPION uptake by macrophages. Furthermore, CD68 immunostaining revealed that Dexa treatment significantly decreased the area and number of synovial macrophages. Prussian blue quantification corresponded to the macrophage measurements and both were in agreement with the MRI findings.
Conclusions: We have demonstrated the feasibility of MRI tracking of in vivo SPION-labeled macrophages to assess RA treatment effects.
Figures


Similar articles
-
Drug delivery to atherosclerotic plaques using superparamagnetic iron oxide nanoparticles.Int J Nanomedicine. 2018 Dec 11;13:8443-8460. doi: 10.2147/IJN.S179273. eCollection 2018. Int J Nanomedicine. 2018. PMID: 30587970 Free PMC article.
-
Accumulation of Iron Oxide-Based Contrast Agents in Rabbit Atherosclerotic Plaques in Relation to Plaque Age and Vulnerability Features.Int J Nanomedicine. 2024 Feb 20;19:1645-1666. doi: 10.2147/IJN.S430693. eCollection 2024. Int J Nanomedicine. 2024. PMID: 38406599 Free PMC article.
-
Targeted Molecular Iron Oxide Contrast Agents for Imaging Atherosclerotic Plaque.Nanotheranostics. 2020 May 30;4(4):184-194. doi: 10.7150/ntno.44712. eCollection 2020. Nanotheranostics. 2020. PMID: 32637296 Free PMC article.
-
'Methyl palmitate attenuates adjuvant induced arthritis in rats by decrease of CD68 synovial macrophages.Biomed Pharmacother. 2021 May;137:111347. doi: 10.1016/j.biopha.2021.111347. Epub 2021 Feb 5. Biomed Pharmacother. 2021. PMID: 33550047
-
Iron-based superparamagnetic nanoparticle contrast agents for MRI of infection and inflammation.AJR Am J Roentgenol. 2015 Mar;204(3):W302-13. doi: 10.2214/AJR.14.12733. AJR Am J Roentgenol. 2015. PMID: 25714316 Free PMC article. Review.
Cited by
-
Efficient delivery of the lncRNA LEF1-AS1 through the antibody LAIR-1 (CD305)-modified Zn-Adenine targets articular inflammation to enhance the treatment of rheumatoid arthritis.Arthritis Res Ther. 2023 Dec 7;25(1):238. doi: 10.1186/s13075-023-03226-0. Arthritis Res Ther. 2023. PMID: 38062469 Free PMC article.
-
The in-vivo use of superparamagnetic iron oxide nanoparticles to detect inflammation elicits a cytokine response but does not aggravate experimental arthritis.PLoS One. 2015 May 8;10(5):e0126687. doi: 10.1371/journal.pone.0126687. eCollection 2015. PLoS One. 2015. PMID: 25955417 Free PMC article.
-
Targeted Nanoparticles with High Heating Efficiency for the Treatment of Endometriosis with Systemically Delivered Magnetic Hyperthermia.Small. 2022 Jun;18(24):e2107808. doi: 10.1002/smll.202107808. Epub 2022 Apr 17. Small. 2022. PMID: 35434932 Free PMC article.
-
Modification of the surface of superparamagnetic iron oxide nanoparticles to enable their safe application in humans.Int J Nanomedicine. 2016 Nov 8;11:5883-5896. doi: 10.2147/IJN.S110579. eCollection 2016. Int J Nanomedicine. 2016. PMID: 27877036 Free PMC article.
-
Nanomedicines for the treatment of rheumatoid arthritis: State of art and potential therapeutic strategies.Acta Pharm Sin B. 2021 May;11(5):1158-1174. doi: 10.1016/j.apsb.2021.03.013. Epub 2021 Mar 12. Acta Pharm Sin B. 2021. PMID: 34094826 Free PMC article. Review.
References
-
- Benderbous S, Corot C, Jacobs P, Bonnemain B. Superparamagnetic agents: Physicochemical characteristics and preclinical imaging evaluation. Acad Radiol. 1996;3:S292–S294. - PubMed
Publication types
MeSH terms
Substances
LinkOut - more resources
Full Text Sources
Other Literature Sources
Medical
