

Evolutionary optimality in sex differences of longevity and athletic performances
- PMID: 24958071
- PMCID: PMC4067624
- DOI: 10.1038/srep05425
Evolutionary optimality in sex differences of longevity and athletic performances
Abstract
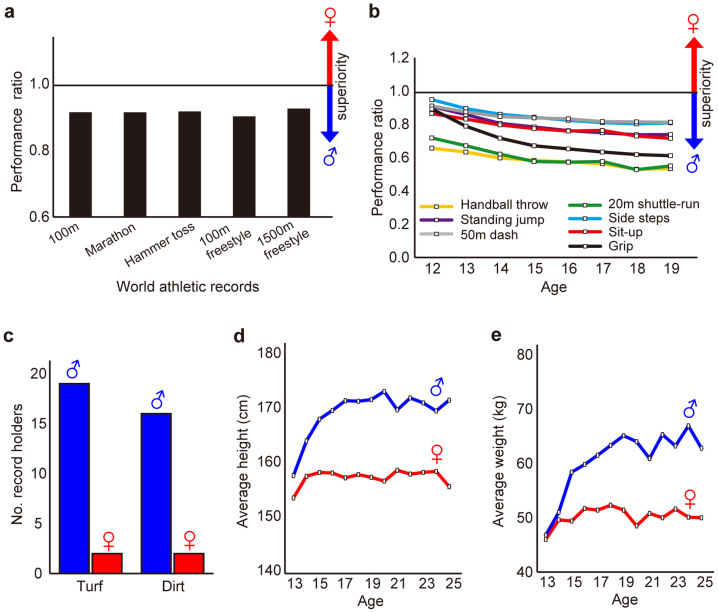
Many sexual differences are known in human and animals. It is well known that females are superior in longevity, while males in athletic performances. Even though some sexual differences are attributed to the evolutionary tradeoff between survival and reproduction, the aforementioned sex differences are difficult to explain by this tradeoff. Here we show that the evolutionary tradeoff occurs among three components: (1) viability, (2) competitive ability and (3) reproductive effort. The sexual differences in longevity and athletic performances are attributed to the tradeoff between viability (survival) and competitive ability that belongs to the physical makeup of an individual, but not related to the tradeoff between survival and reproduction. This provides a new perspective on sex differences in human and animals: females are superior in longevity and disease recovery, while males are superior in athletic performance.
Figures


Similar articles
-
Sexual cooperation: mating increases longevity in ant queens.Curr Biol. 2005 Feb 8;15(3):267-70. doi: 10.1016/j.cub.2005.01.036. Curr Biol. 2005. PMID: 15694312
-
No intra-locus sexual conflict over reproductive fitness or ageing in field crickets.PLoS One. 2007 Jan 17;2(1):e155. doi: 10.1371/journal.pone.0000155. PLoS One. 2007. PMID: 17225859 Free PMC article.
-
Longevity cost of reproduction for males but no longevity cost of mating or courtship for females in the male-dimorphic dung beetle Onthophagus binodis.J Insect Physiol. 2003 Sep;49(9):817-22. doi: 10.1016/S0022-1910(03)00117-3. J Insect Physiol. 2003. PMID: 16256683
-
Sexual selection: the importance of long-term fitness measures.Curr Biol. 2005 May 10;15(9):R334-6. doi: 10.1016/j.cub.2005.04.023. Curr Biol. 2005. PMID: 15886090 Review.
-
Life history evolution, reproduction, and the origins of sex-dependent aging and longevity.Ann N Y Acad Sci. 2017 Feb;1389(1):92-107. doi: 10.1111/nyas.13302. Epub 2016 Dec 23. Ann N Y Acad Sci. 2017. PMID: 28009055 Review.
Cited by
-
Differences in adult nutritional requirements impact the population growth and survival of two related species of rice leaffolders to produce interspecific differentiation.Sci Rep. 2024 Jul 26;14(1):17200. doi: 10.1038/s41598-024-66512-0. Sci Rep. 2024. PMID: 39060323 Free PMC article.
-
Sexual complementarity between host humoral toxicity and soldier caste in a polyembryonic wasp.Sci Rep. 2016 Jul 7;6:29336. doi: 10.1038/srep29336. Sci Rep. 2016. PMID: 27385149 Free PMC article.
References
-
- Trivers R. L. Social Evolution. (Benjamin-Cummings, San Francisco, 1985).
-
- United Nations. World Population Prospects, the 2010 Revision. http://esa.un.org/wpp/Excel-Data/mortality.htm (2013). Accessed 28 November 2012.
-
- World Health Organization. World Health Statistics 2011. http://www.who.int/gho/publications/world_health_statistics/EN_WHS2011_F... (2012). Accessed 28 November 2012.
-
- Austad S. T. Why woman live longer than men: sex differences in longevity. Gend. Med. 3, 79–92 (2006). - PubMed
-
- International Association of Athletics Federations. RECORDS & LISTS. http://www.iaaf.org/records/toplists/sprints/100-metres/outdoor/men/senior/ (2012). Accessed 28 November 2012.
Publication types
MeSH terms
LinkOut - more resources
Full Text Sources
Other Literature Sources
