. 2013 Aug 13;3(3):701-17.
doi: 10.3390/metabo3030701.

Electrospray Quadrupole Travelling Wave Ion Mobility Time-of-Flight Mass Spectrometry for the Detection of Plasma Metabolome Changes Caused by Xanthohumol in Obese Zucker (fa/fa) Rats

Affiliations

Electrospray Quadrupole Travelling Wave Ion Mobility Time-of-Flight Mass Spectrometry for the Detection of Plasma Metabolome Changes Caused by Xanthohumol in Obese Zucker (fa/fa) Rats

Samanthi I Wickramasekara et al. Metabolites. .

Abstract

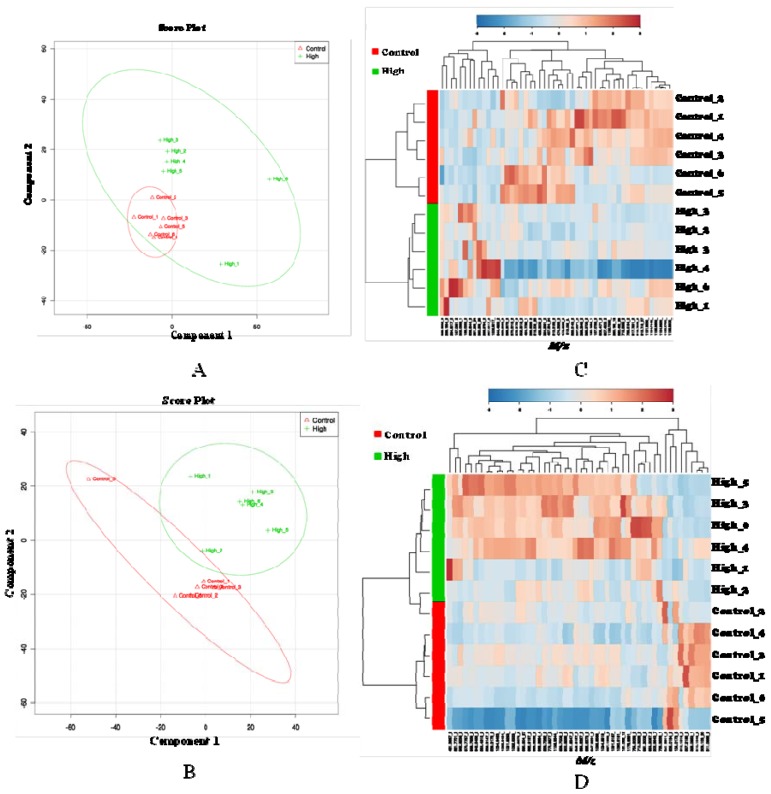
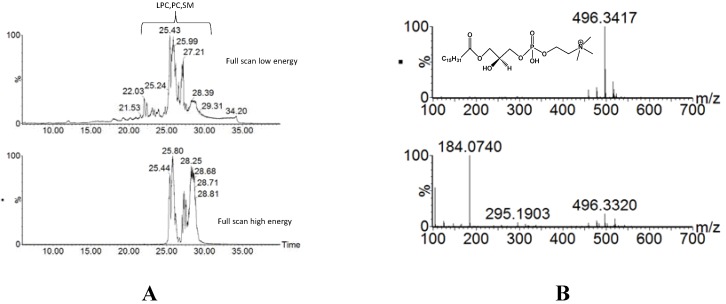
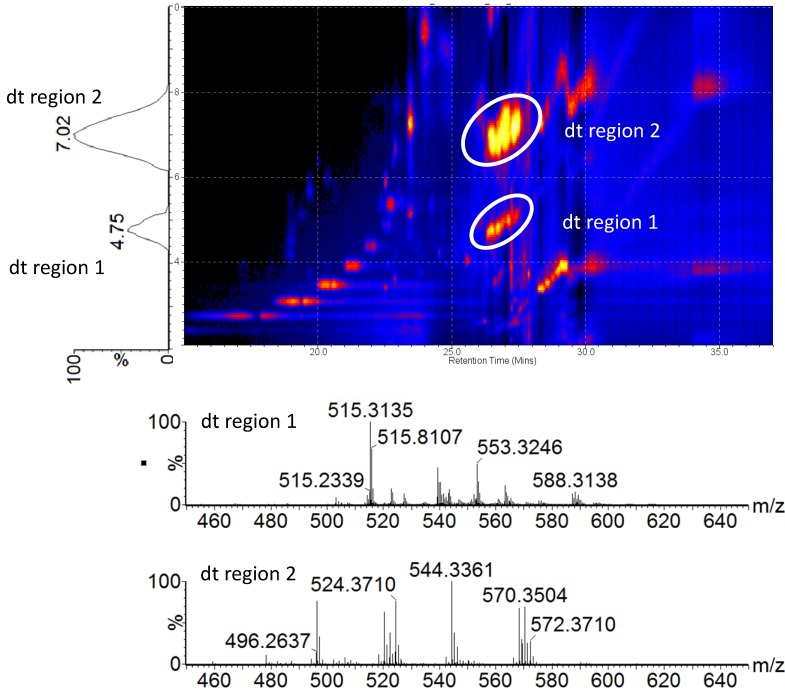
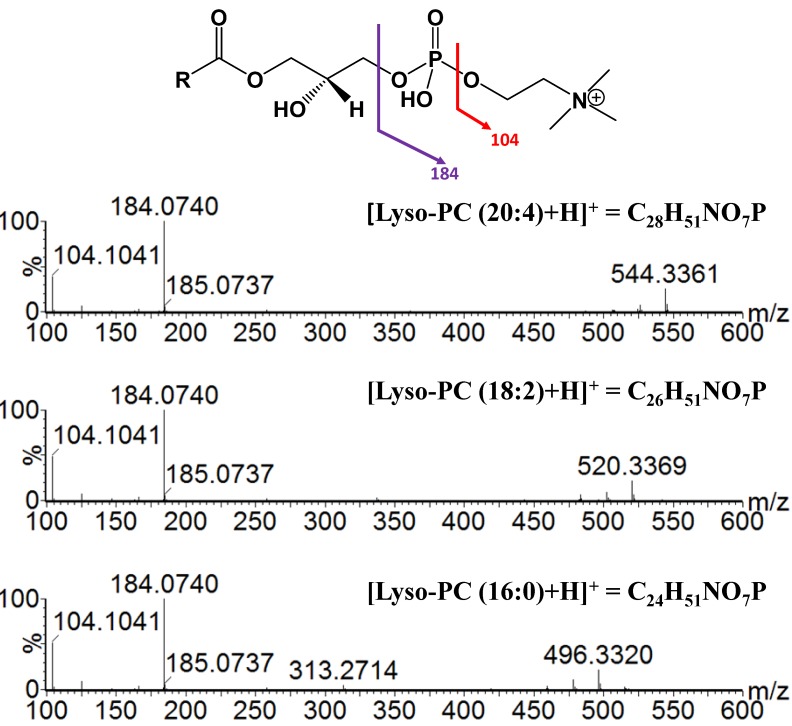
This study reports on the use of traveling wave ion mobility quadrupole time-of-flight (ToF) mass spectrometry for plasma metabolomics. Plasma metabolite profiles of obese Zucker fa/fa rats were obtained after the administration of different oral doses of Xanthohumol; a hop-derived dietary supplement. Liquid chromatography coupled data independent tandem mass spectrometry (LC-MSE) and LC-ion mobility spectrometry (IMS)-MSE acquisitions were conducted in both positive and negative modes using a Synapt G2 High Definition Mass Spectrometry (HDMS) instrument. This method provides identification of metabolite classes in rat plasma using parallel alternating low energy and high energy collision spectral acquisition modes. Data sets were analyzed using pattern recognition methods. Statistically significant (p < 0.05 and fold change (FC) threshold > 1.5) features were selected to identify the up-/down-regulated metabolite classes. Ion mobility data visualized using drift scope software provided a graphical read-out of differences in metabolite classes.


Figures

Figure 1
Figure 1
Partial Least Square-Discriminant Analysis (PLS-DA) plot (A, B) and unsupervised hierarchical clustering plot (C, D) for control and high dose groups (male animals). (A, C) positive ionization mode; (B, D) negative ionization mode; a heat map was constructed using the top 50 important metabolites created from MetaboAnalyst software (2.0). The metabolites and samples were hierarchically clustered by the Ward algorithm using Euclidian distance. Each column represents a unique feature with a characteristic mass-to-charge ratio and retention time value. As shown in the heat map alignment, the two groups were clustered by an unsupervised algorithm, which confirms the presence of discriminating features between the high dose and control groups.
Figure 2
Figure 2
(A) Full scan mass spectrometry (MS) chromatograms obtained in MSE mode using low (top) and high (bottom) energy regimes. Extracted ion chromatogram (XIC) obtained with an m/z of 184.0740 (phosphocholine head group) enables localization of the elution window for lysophosphatidyl choline (Lyso-PC), phosphatidyl cholines (PC) and sphingomyelin (SM) lipid classes. (B) Extracted mass spectra of low- (top) and high- (bottom) collision energy for [Lyso-PC (16:0) + H]+ − (C24H51NO7P).The low-energy spectrum contains the precursor ion at m/z 496.3417 ([M+H]+), whereas the high-energy spectrum is dominated by the fragment ion for the phosphocholine head group (m/z 184.0740).
Figure 3
Figure 3
An example of a 2D image (drift time vs. retention time) showing the ion mobility separation of different compound classes in rat plasma samples. The encircled regions mark the compound classes that eluted within a similar retention time window (26–28 min). Drift time-extracted spectra (bottom) show that these two clusters belong to different lipid classes, namely Lyso-PC and SM lipids (sphingosine phosphocholines) that have drift time distributions centered around 7.02 ms and 4.75 ms, respectively.
Figure 4
Figure 4
MS/MS spectra extracted from the high energy ion mobility spectrometry (IMS) function corresponding to drift time region 2 (~7.0 ms), which contains different Lyso-PCs. The general structure and the predicted fragmentation positions are given at the top. Both saturated and unsaturated ions give rise to the same characteristic fragment ion in high energy mode. The top right corner of each spectrum contains the molecular formula for the selected Lyso-PC ion.
Figure 5
Figure 5
Ion mobility correlation analyses for the significant features identified in (A) positive and (B) negative ionization modes. Data were acquired in low energy IMS-MSE mode, and the tentative compound identifications were obtained based on their accurate mass measurements.

References

    1. Escobar-Morreale H.F., Samino S., Insenser M., Vinaixa M., Luque-Ramirez M., Lasuncion M.A., Correig X. Metabolic heterogeneity in polycystic ovary syndrome is determined by obesity: Plasma metabolomic approach using GC-MS. Clin. Chem. 2012;58:999–1009. doi: 10.1373/clinchem.2011.176396. - DOI - PubMed
    1. Lin S., Liu N., Yang Z., Song W., Wang P., Chen H., Lucio M., Schmitt-Kopplin P., Chen G., Cai Z. GC/MS-based metabolomics reveals fatty acid biosynthesis and cholesterol metabolism in cell lines infected with influenza A virus. Talanta. 2010;83:262–268. doi: 10.1016/j.talanta.2010.09.019. - DOI - PubMed
    1. Xiao J.F., Zhou B., Ressom H.W. Metabolite identification and quantitation in LC-MS/MS-based metabolomics. Trac-Trend Anal. Chem. 2012;32:1–14. doi: 10.1016/j.trac.2011.08.009. - DOI - PMC - PubMed
    1. Lu W., Bennett B.D., Rabinowitz J.D. Analytical strategies for LC-MS-based targeted metabolomics. J. Chromatogr. B. 2008;871:236–242. doi: 10.1016/j.jchromb.2008.04.031. - DOI - PMC - PubMed
    1. Ramautar R., Somsen G.W., de Jong G.J. CE-MS for metabolomics: Developments and applications in the period 2010–2012. Electrophoresis. 2013;34:86–98. doi: 10.1002/elps.201200390. - DOI - PubMed