. 2014 Jun 23;205(6):791-9.
doi: 10.1083/jcb.201401049.

SLK-dependent activation of ERMs controls LGN-NuMA localization and spindle orientation

Affiliations

SLK-dependent activation of ERMs controls LGN-NuMA localization and spindle orientation

Mickael Machicoane et al. J Cell Biol. .

Abstract

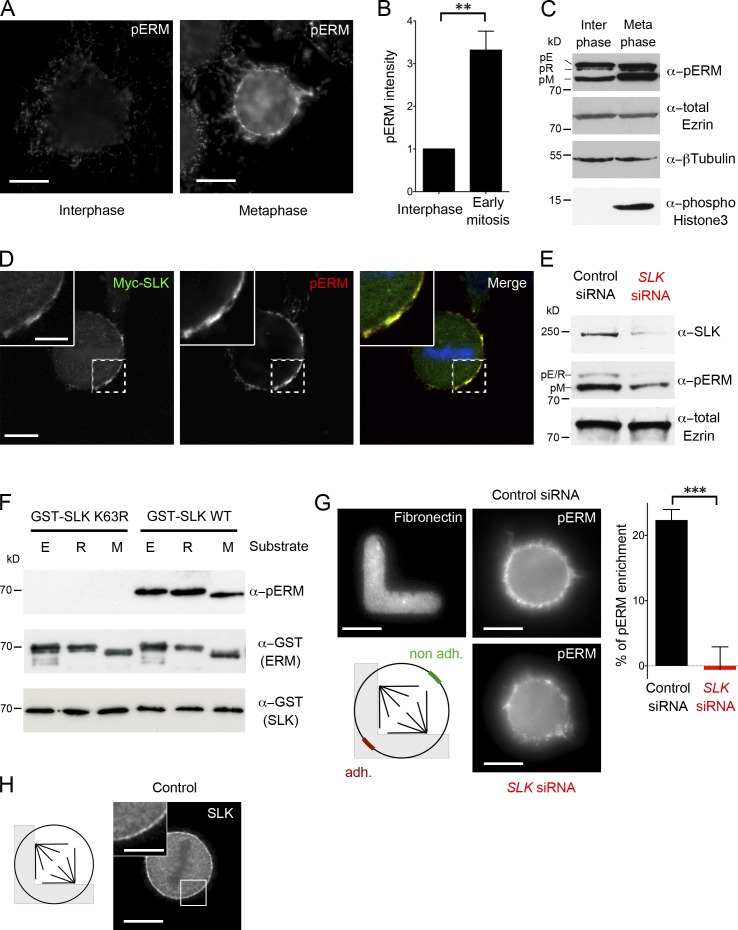
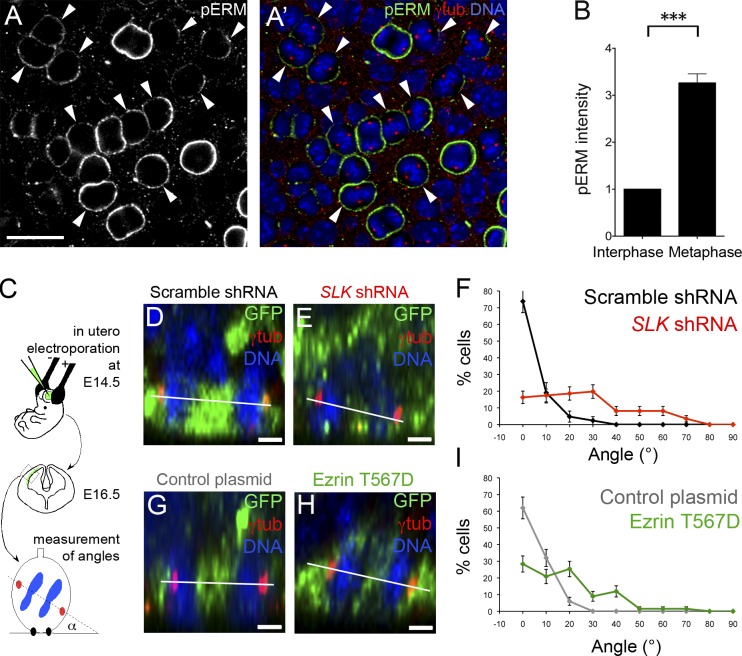
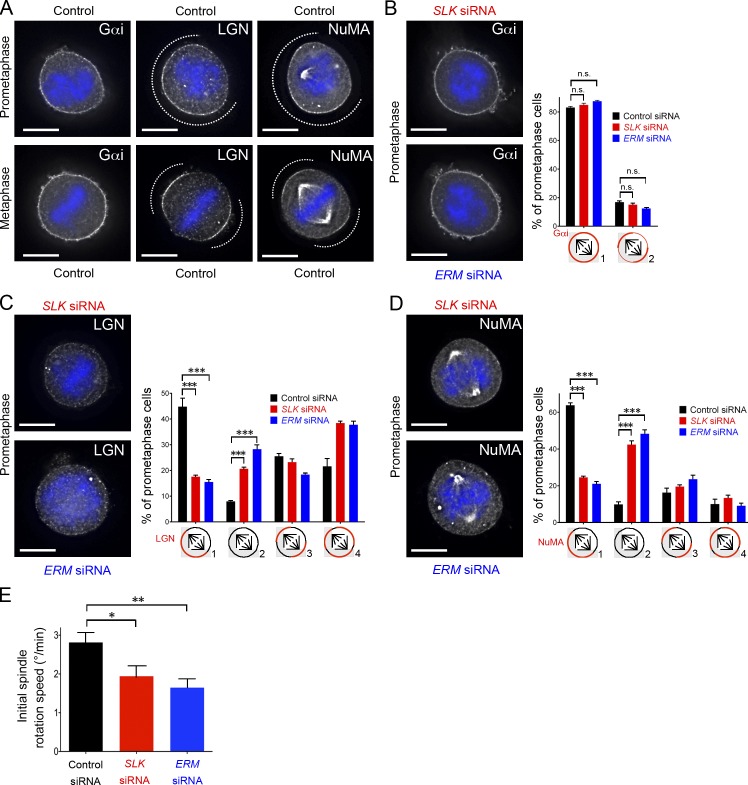
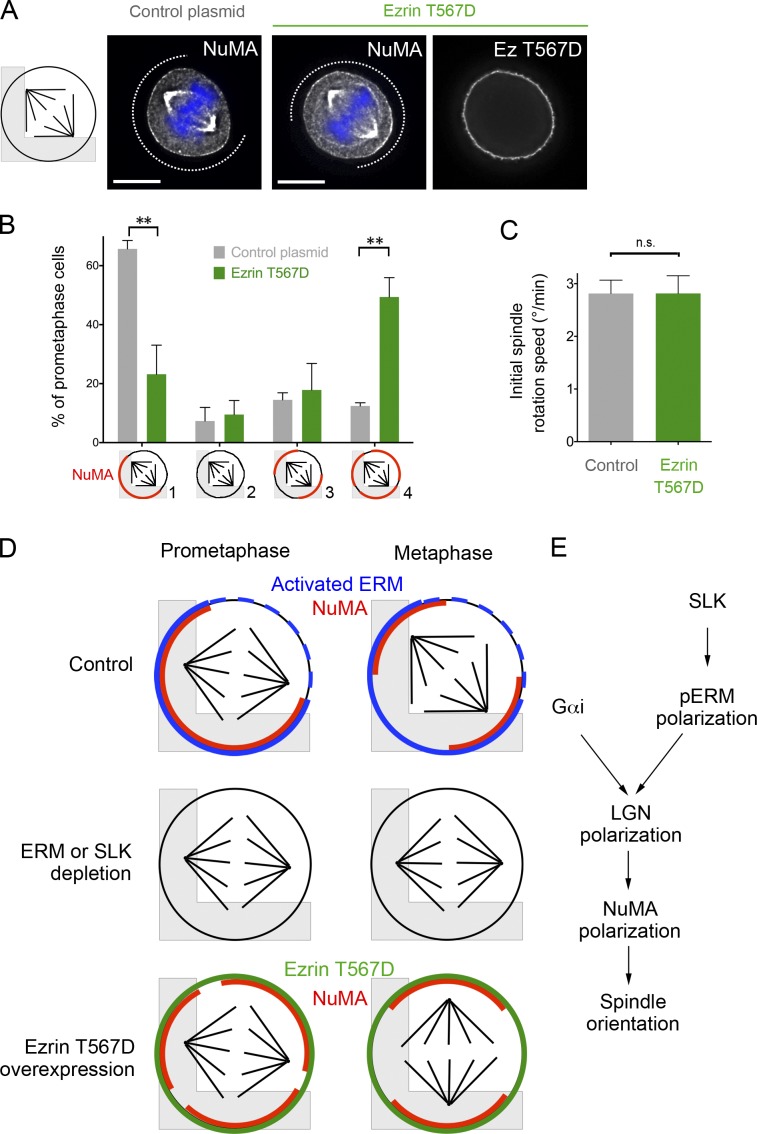
Mitotic spindle orientation relies on a complex dialog between the spindle microtubules and the cell cortex, in which F-actin has been recently implicated. Here, we report that the membrane-actin linkers ezrin/radixin/moesin (ERMs) are strongly and directly activated by the Ste20-like kinase at mitotic entry in mammalian cells. Using microfabricated adhesive substrates to control the axis of cell division, we found that the activation of ERMs plays a key role in guiding the orientation of the mitotic spindle. Accordingly, impairing ERM activation in apical progenitors of the mouse embryonic neocortex severely disturbed spindle orientation in vivo. At the molecular level, ERM activation promotes the polarized association at the mitotic cortex of leucine-glycine-asparagine repeat protein (LGN) and nuclear mitotic apparatus (NuMA) protein, two essential factors for spindle orientation. We propose that activated ERMs, together with Gαi, are critical for the correct localization of LGN-NuMA force generator complexes and hence for proper spindle orientation.


Figures

Figure 1.
Figure 1.
SLK directly phosphorylates mammalian ERM proteins and controls their cortical activation in mitosis. (A) Staining of pERMs in interphase and metaphase HeLa cells (single plane, same settings). (B) FACS quantification of pERM levels (mean ± SEM; arbitrary units) in early mitosis (MPM2-positive cells) and interphase (MPM2-negative cells). n = 4; **, P < 2 × 10⁻³ (Student t test). (C) Western blot of total lysates from interphase and metaphase cells, using antibodies against pERMs, total ezrin, β-tubulin (loading control), and phospho-Histone3 (mitotic marker). (D) Confocal slice of a metaphase cell expressing Myc-SLK (green) and stained for pERMs (red). (E) Western blot of total lysates from metaphase cells treated with control siRNA (black) or SLK siRNA (red), using antibodies against SLK, pERMs, and total ezrin. (F) In vitro kinase assay using recombinant wild-type (WT) or catalytically dead (K63R) kinase domain of SLK (aa 1–344) and GST-ezrinC-ter, GST-radixinC-ter, or GST-moesinC-ter, as substrates, in the presence of ATP. ERM phosphorylation was detected by Western blot with pERM antibodies. (G) Staining of pERMs in mitotic cells plated on L-shaped micropatterns, after control or SLK depletion, as indicated. (top left) Fibronectin staining showing the micropattern shape. The bias [100 × (adh. − nonadh.)/(nonadh.)] of pERM staining at the cortex facing the adhesive versus nonadhesive substrate is presented on the right. Mean ± SEM; n > 85 cells; ***, P < 10−3 (Student t test). (H) Staining of endogenous SLK in a metaphase micropatterned cell. Bars: (main) 10 µm; (insets) 5 µm.
Figure 2.
Figure 2.
ERM activation is required for guiding the mitotic spindle to its final correct orientation. (A) Control siRNA-treated Histone2B-expressing cells were cultured on L-shaped fibronectin micropattern and recorded by time-lapse microscopy. The distribution of the angle of cell division axis (α) at anaphase onset (black curve) is shown (mean ± SD on five independent experiments; n > 1,200 cells). Bar, 5 µm. (B) Evolution of the spindle angle as a function of time starting at late prometaphase, plotted for a dozen cells described in A. (C, E, and G) Same analysis as in A after SLK depletion (C, red curve), after simultaneous depletion of the three ERMs (E, blue curve), and after ezrin T567D overexpression (G, green curve). 500–1,000 cells from at least three independent experiments. In C and E, the black curve corresponds to cells transfected with control siRNA. In G, the gray curve corresponds to cells transfected with a control plasmid. In all cases, the angle distributions were different from controls, with P < 10−5 (Kolmogorov-Smirnov test). (D, F, and H) Same analysis as in B for cells described in C, E, and G, respectively.
Figure 3.
Figure 3.
ERM activation is essential for proper spindle orientation in mouse apical progenitors. (A and A’) En face confocal view of apical progenitors at E16.5 stained for pERMs (green), γ-tubulin (red), and DAPI (blue). Focus has been made at the plane containing the spindle poles of mitotic progenitors. Arrowheads point to prometaphase and metaphase cells. Bar, 20 µm. (B) Quantification of cortical pERM intensity (mean ± SEM; arbitrary units) at the cortex in metaphase and adjacent interphase cells. n = 85 cells; ***, P < 10−5. (C) Schematic representation of the experimental procedure using in utero electroporation in mouse embryos at E14.5 and analyzed at E16.5. Transfected cells expressed GFP. (D, E, G, and H) Z-views obtained from en face confocal images of the cerebral neocortex electroporated with scramble (D) or Slk-shRNA–encoding plasmids (E) or with empty (G) or ezrin T567D–encoding vectors (H). The scramble shRNA panel (D) is shown again in Fig. S1 K. (F and I) Percentage of cells dividing at a specific angle α, using the measurement conventions indicated in C (mean ± SD; n = 50–85 cells from three to six independent embryos). The angle distributions were different from controls, with P < 10−5 (Kolmogorov-Smirnov test). Bars, 1 µm.
Figure 4.
Figure 4.
Localized LGN and NuMA association with the cell cortex relies on ERM activation. (A–D) Endogenous Gαi, LGN, and NuMA staining in prometaphase and metaphase cells cultured on L-shaped micropatterns. The micropatterns are oriented as in Fig. 1 G. Dotted lines indicate LGN–NuMA extent at the cortex. Metaphase corresponds to cells with fully congressed chromosomes and promometaphase corresponds to cells after nuclear envelope breakdown but without fully congressed chromosomes. DAPI staining is displayed in blue. The three prometaphase control panels are shown again in Fig. S2 A, and the NuMA metaphase panel is shown again in Fig. S2 B. Endogenous Gαi (B), LGN (C), and NuMA (D) staining in prometaphase micropatterned cells after SLK or ERM depletion. For each marker, the percentage of prometaphase cells (mean ± SEM) displaying the indicated localization (categories 1–4) is quantified after control (black), SLK (red), and ERM (blue) depletion. n > 50 cells, n = 2 (B); n > 125 cells, n = 3 (C); n = >150 cells, n = 6 (D); ***, P < 3 × 10⁻⁴ (Student t test). (E) Initial speed of spindle rotation (degree/min) in the first 5 min of chromosome congression, after control (black), SLK (red), and ERM (blue) depletion. Mean ± SEM; n > 60 cells; n = 3. n.s., not significant; *, P < 0.05; **, P < 2 × 10⁻² (Student t test). Bars, 10 µm.
Figure 5.
Figure 5.
ERM hyperactivation perturbs spindle orientation and NuMA localization, and a proposed model showing the role of activated ERMs in the polarized localization of NuMA and spindle orientation. (A) NuMA staining in prometaphase in control or ezrin T567D–expressing cells cultured on micropatterns. (B) Same quantification as in Fig. 4 D in control (gray) or ezrin T567D–expressing cells (green). (C) Same quantification as in Fig. 4 E in control or ezrin T567D–expressing cells. Phenotypic summary (D) and proposed model (E). Bars, 10 µm.

References

    1. Belkina N.V., Liu Y., Hao J.J., Karasuyama H., Shaw S. 2009. LOK is a major ERM kinase in resting lymphocytes and regulates cytoskeletal rearrangement through ERM phosphorylation. Proc. Natl. Acad. Sci. USA. 106:4707–4712 10.1073/pnas.0805963106 - DOI - PMC - PubMed
    1. Carreno S., Kouranti I., Glusman E.S., Fuller M.T., Echard A., Payre F. 2008. Moesin and its activating kinase Slik are required for cortical stability and microtubule organization in mitotic cells. J. Cell Biol. 180:739–746 10.1083/jcb.200709161 - DOI - PMC - PubMed
    1. Castanon I., Abrami L., Holtzer L., Heisenberg C.P., van der Goot F.G., Gonzalez-Gaitan M. 2013. Anthrax toxin receptor 2a controls mitotic spindle positioning. Nat. Cell Biol. 15:28–39 10.1038/ncb2632 - DOI - PubMed
    1. Chesneau L., Dambournet D., Machicoane M., Kouranti I., Fukuda M., Goud B., Echard A. 2012. An ARF6/Rab35 GTPase cascade for endocytic recycling and successful cytokinesis. Curr. Biol. 22:147–153 10.1016/j.cub.2011.11.058 - DOI - PubMed
    1. Dambournet D., Machicoane M., Chesneau L., Sachse M., Rocancourt M., El Marjou A., Formstecher E., Salomon R., Goud B., Echard A. 2011. Rab35 GTPase and OCRL phosphatase remodel lipids and F-actin for successful cytokinesis. Nat. Cell Biol. 13:981–988 10.1038/ncb2279 - DOI - PubMed

Publication types

MeSH terms