Clinical Trial
. 2014 Jun 30;211(7):1349-62.
doi: 10.1084/jem.20130477. Epub 2014 Jun 23.

Human CalDAG-GEFI gene (RASGRP2) mutation affects platelet function and causes severe bleeding

Affiliations
Clinical Trial

Human CalDAG-GEFI gene (RASGRP2) mutation affects platelet function and causes severe bleeding

Matthias Canault et al. J Exp Med. .

Abstract

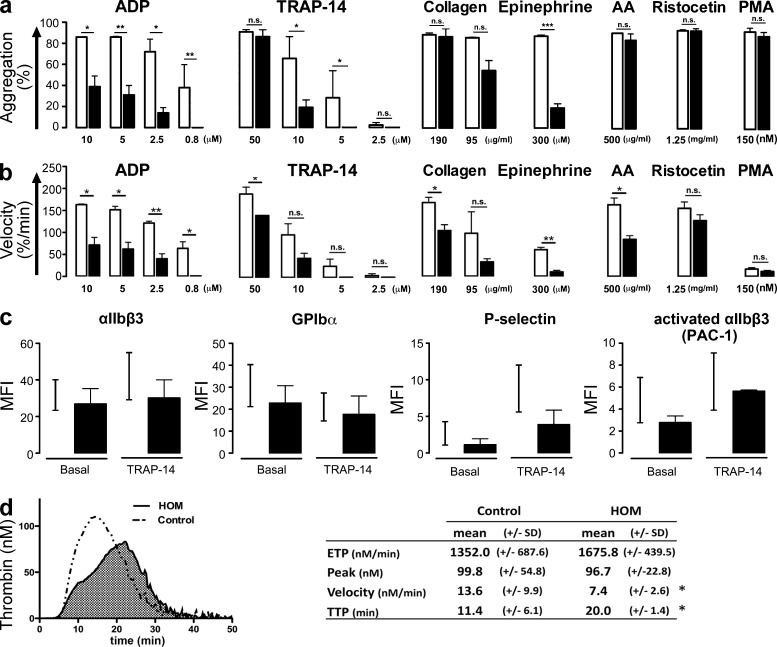
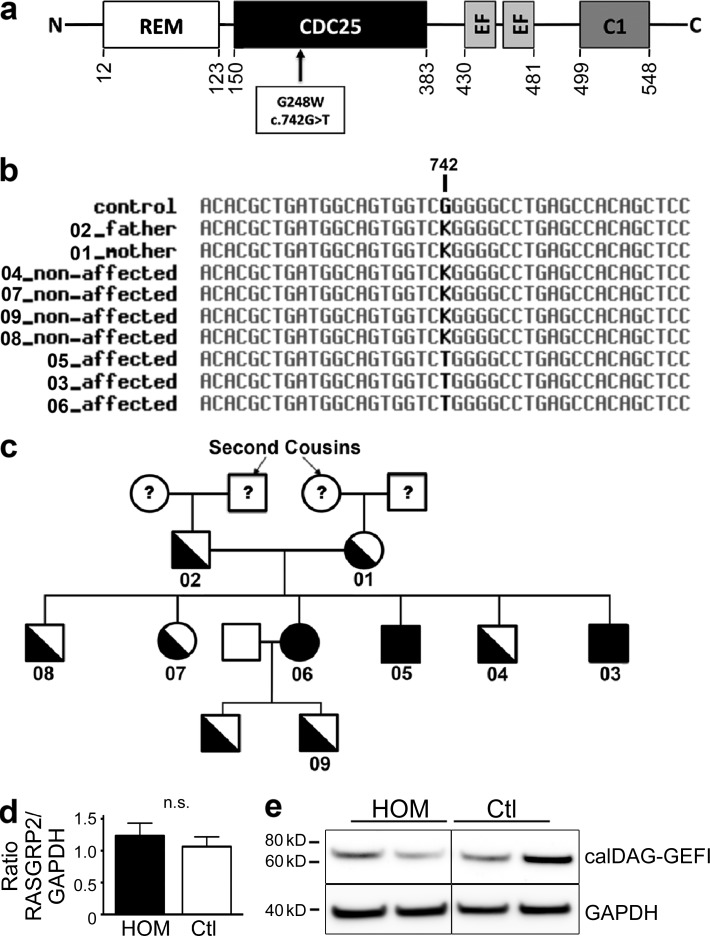
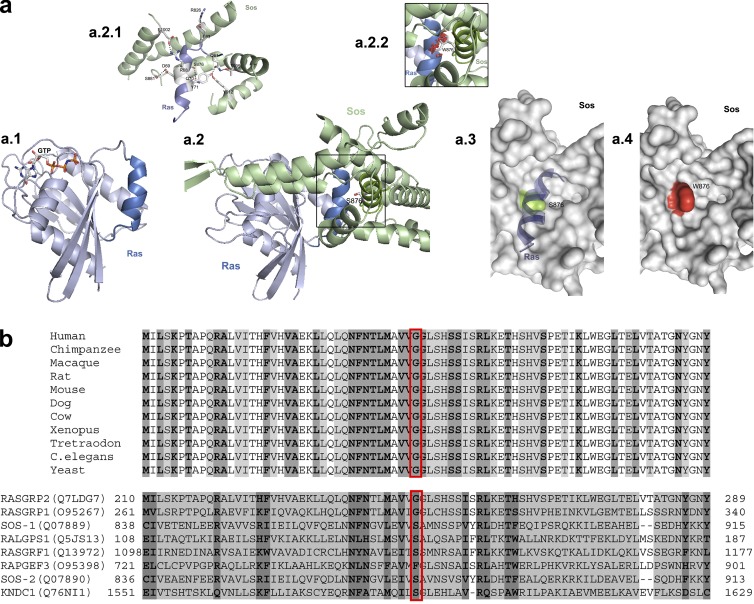
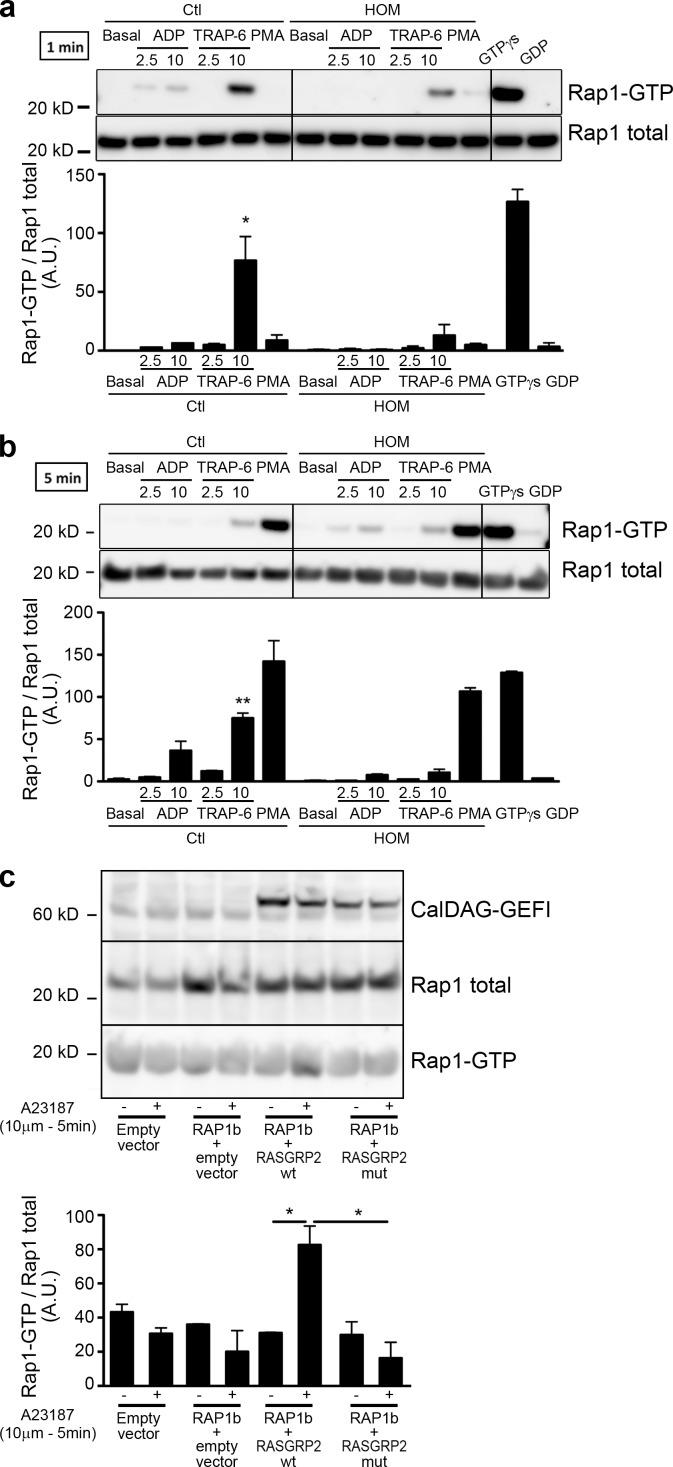
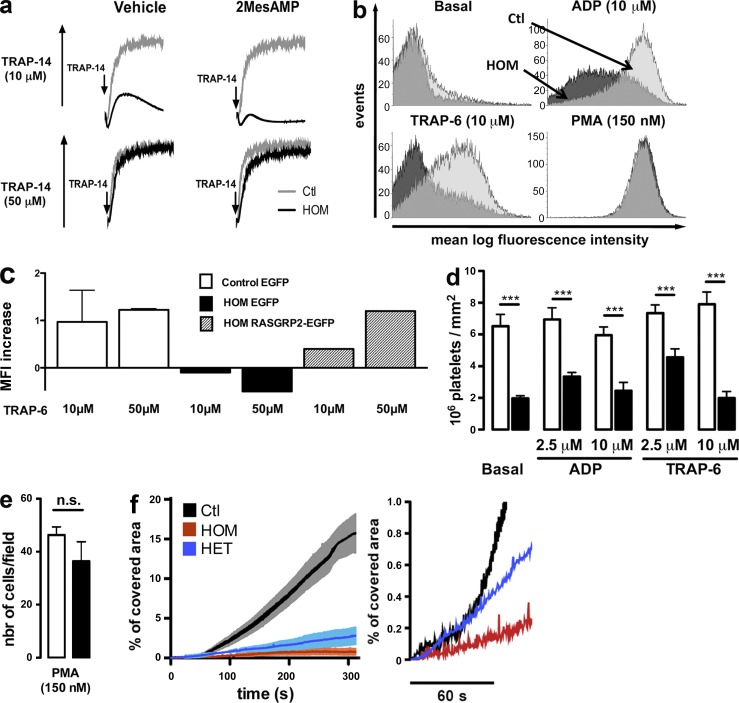
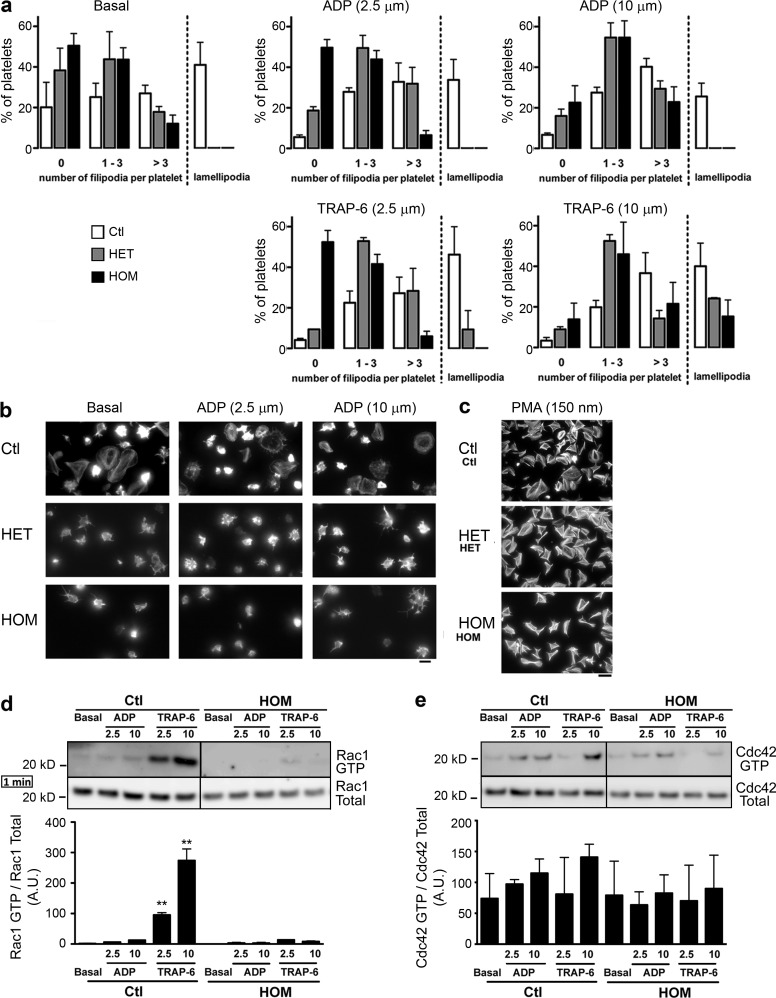
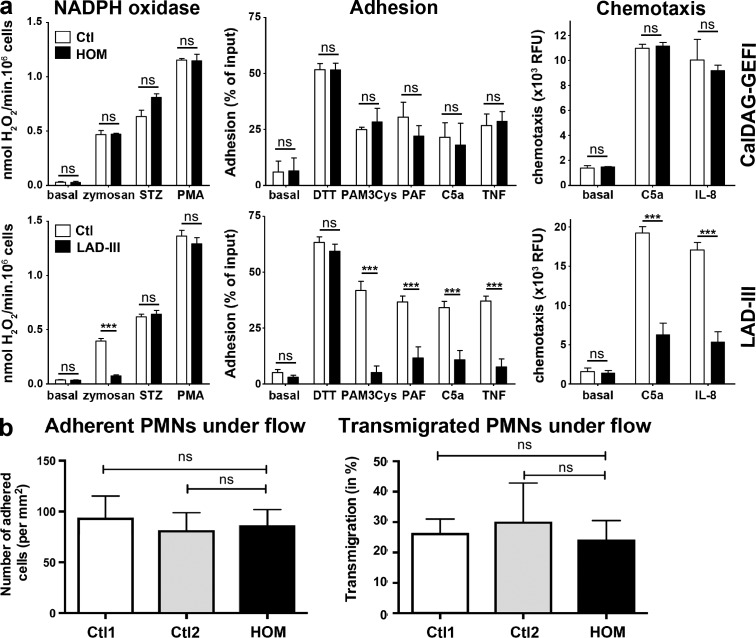
The nature of an inherited platelet disorder was investigated in three siblings affected by severe bleeding. Using whole-exome sequencing, we identified the culprit mutation (cG742T) in the RAS guanyl-releasing protein-2 (RASGRP2) gene coding for calcium- and DAG-regulated guanine exchange factor-1 (CalDAG-GEFI). Platelets from individuals carrying the mutation present a reduced ability to activate Rap1 and to perform proper αIIbβ3 integrin inside-out signaling. Expression of CalDAG-GEFI mutant in HEK293T cells abolished Rap1 activation upon stimulation. Nevertheless, the PKC- and ADP-dependent pathways allow residual platelet activation in the absence of functional CalDAG-GEFI. The mutation impairs the platelet's ability to form thrombi under flow and spread normally as a consequence of reduced Rac1 GTP-binding. Functional deficiencies were confined to platelets and megakaryocytes with no leukocyte alteration. This contrasts with the phenotype seen in type III leukocyte adhesion deficiency caused by the absence of kindlin-3. Heterozygous did not suffer from bleeding and have normal platelet aggregation; however, their platelets mimicked homozygous ones by failing to undergo normal adhesion under flow and spreading. Rescue experiments on cultured patient megakaryocytes corrected the functional deficiency after transfection with wild-type RASGRP2. Remarkably, the presence of a single normal allele is sufficient to prevent bleeding, making CalDAG-GEFI a novel and potentially safe therapeutic target to prevent thrombosis.


Figures

Figure 1.
Figure 1.
Characterization of the patients’ platelet function. (a) Platelet maximal aggregation (%) and (b) velocity (%/min) from 2 patients (filled bars) and 3 healthy volunteers (open bars) induced by ADP, TRAP-14, collagen, epinephrine, arachidonic acid, ristocetin, and PMA tested on 5 different occasions (Student’s t test; *, P < 0.05; **, P < 0.01; ***, P < 0.001). (c) Levels of αIIbβ3 integrin, GPIbα, P-selectin, and PAC-1 binding (activated αIIbβ3) on resting and TRAP-14 (50 µM)-stimulated platelets from 2 patients measured by flow cytometry and expressed as mean fluorescence intensity (MFI). Black lines represent the range between minimum and maximum MFI obtained from healthy volunteers (n = 8). (d) Endogenous thrombin generation in PRP (left) and representative thrombograms (right). Thrombogram parameters: area-under-the-curve or ETP (total thrombin activity during coagulation); peak height (maximal rate of thrombin formation); reaction velocity and time to thrombin peak (n = 5 for controls; n = 2 for HOM; Student’s t test, *, P < 0.05).
Figure 2.
Figure 2.
RASGRP2 gene mutation screening in family members and CalDAG-GEFI expression in platelets of the patients. (a) CalDAG-GEFI primary structure showing the G248W substitution and the different structural domains: ras exchange motif (REM), catalytic domain (CDC25), calcium-binding EF hands (EF), and diacylglycerol-binding (C1). (b) Multiple alignment of genomic DNA sequence (Chr11: 64,494,383-64,512,928; National Center for Biotechnology Information Build 36) surrounding the putative disease-causing mutation (in bold). K is the IUPAC-IUB ambiguity code for G or T. (c) Family pedigree. Whole-exome sequencing was performed in #01, #02, #04, #05, and #06. Direct capillary sequencing confirmed the complete segregation of the p.G248W mutation. (d) Relative CalDAG-GEFI mRNA expression levels from homozygous (HOM) and healthy (Ctl) platelets. The relative amounts of RASGRP2 mRNA were normalized to GAPDH mRNA levels. Data are mean ± SEM (Student’s t test). (e) Representative Western blot for CalDAG-GEFI in platelet lysates from two homozygous (HOM) and two healthy subjects (Ctl). GAPDH expression was used as equal loading and electrophoretic transfer control.
Figure 3.
Figure 3.
Predicted structural consequences on CalDAG-GEFI of the RASGRP2 mutation. (a) SOS-2/Ha-ras protein sequence modeling. (a.1) Computer-drawn ribbon diagram of Ha-ras (light blue) and an analogue of GTP (sticks). (a.2) Ha-ras (light blue) in association with Sos-2 (pale green). The frame indicates the region of the tight interaction of Ha-ras with the CDC25 domain of the Sos-2 protein concerned by the mutated amino acid. (a.2.1) Amino acids (sticks) contributing to H-bonds (dotted lines) for the CDC25 domain of Sos-2 and its interaction with Ha-ras. The S876W mutation is shown in a small window (a.2.2) as a graphical stick representation; graphical “bumps” (red discs) indicate steric interactions caused by the S876W substitution. (a.3 and a.4) The CDC25 domain-forming cavity is depicted as a molecular surface. S876 (a.3) is colored in green. α-Helix of Ha-ras lying within the cavity is shown in blue. W876 forming protrusion (a.4) is colored in red. (b) Sequence alignment of RASGRP2 (SCR2 region) through species (orthologue; top), and through different members of their protein family in human (paralogue; bottom). The frame highlights the amino acids participating in the H-bonds.
Figure 4.
Figure 4.
pG248W transition impairs CalDAG-GEFI’s ability to activate Rap1. Activated Rap1 (Rap1-GTP) was detected in platelet lysates obtained from homozygous (HOM) and control (Ctl) subjects at 1 (a) and 5 min (b) after addition of ADP, TRAP-6, or PMA (150 nM). Incubation with GTPγS and GDP were performed on platelet lysates from a homozygous patient. Presented results are representative of three independent experiments. Densitometry analysis shows the band density ratios of Rap1 GTP to total Rap1 as indicated in the panels below. Student’s t test revealed significant differences between control subject and homozygous patient platelet preparation treated with corresponding agonists (*, P > 0.05; **, P > 0.001). Data are mean ± SEM; n = 3. (c) CalDAG-GEFI–dependent activation of Rap1 in HEK293T. Rap1 was co-transfected with either the empty vector or the mutated form of RASGRP2. After stimulation with calcium ionophore (10 µM, 5 min), cells were lysed and Rap1-GTP was pulled down. The representative blots of two independent experiments are shown. Densitometry analysis shows the band density ratios of Rap1 GTP to total Rap1 as indicated in the left panel. Student’s t test revealed significant differences (*, P > 0.05). Data are mean ± SEM; n = 2.
Figure 5.
Figure 5.
Evidence for CalDAG-GEFI bypassing pathways and defective platelet adhesion caused by the CalDAG-GEFI mutation. (a) Aggregation tracings from homozygous (HOM) and normal (Ctl) platelets with low- (top) or high-dose (bottom) TRAP-14 with or without the P2Y12 inhibitor 2MesAMP (100 µM). (b) FITC-labeled fibrinogen binding to platelets. Histograms are representative MFI of two independent experiments. (c) Alexa Fluor 647–labeled fibrinogen binding to megakaryocytes from a HOM patient and healthy controls (n = 2) transduced with RASGRP2-EGFP vector or EGFP vector control. On megakaryocytes, fibrinogen binding upon stimulation of cells in suspension by TRAP-6 (10 and 50 µM) was measured by flow cytometry. Results are expressed as MFI increase over the unstimulated state. (d) Static adhesion of platelets from homozygous (n = 2) and healthy (n = 6) subjects on fibrinogen (mean ± SEM 106 platelets/mm2; Student’s t test; ***, P < 0.001). (e) PMA-induced adhesion on fibrinogen of platelets from homozygous (filled bars; n = 1) and healthy (open bars; n = 4) subjects (mean ± SEM platelet per view field; Student’s t test). (f) Adhesion under flow (750 s−1) on collagen of calcein-AM–labeled platelets from a homozygous (HOM), a heterozygous (HET), or a healthy (Ctl) subject. Percentage of covered area was assessed over 300 s (left). The initial 60 s are magnified (right). Results are mean ± SEM; (n = 3 in each groups).
Figure 6.
Figure 6.
Incomplete platelet spreading results from the p.G248W transition in CalDAG-GEFI. (a) Platelet spreading over immobilized fibrinogen from homozygous (HOM), heterozygous (HET), or healthy (Ctl) subjects. Representative results from two separate experiments, expressed as means ± SEM of 5 different view fields (Chi-squared test; for Ctl vs. HOM and Ctl vs. HET, P < 0.001 in all tested conditions; for HOM vs. HET: P < 0.001 for ADP 2.5 µM and TRAP-6 2.5 µM, P = 0.186 at basal state, P = 0.378 for ADP 10 µM, and P = 0.669 for TRAP-6 10 µM). (b and c) Representative images of platelet spreading from homozygous (HOM), heterozygous (HET) or healthy (Ctl) subjects in the presence of ADP and PMA (scale bars are 4 µm and 20 µm for b and c, respectively). (d and e) GTP loading shown for Rac1 and Cdc42 for platelets of HOM and Ctl subjects for ADP or TRAP-6 stimulation for 1 min. Representative blots of three independent experiments. Densitometry analysis shows the band density ratios of Rac1 GTP to total Rac1 and Cdc42 GTP to total Cdc42 as indicated in the panels below. Student’s t test revealed significant differences between control subject and homozygous patient platelet preparation treated with corresponding agonists (**, P > 0.001). Data are mean ± SEM; n = 3.
Figure 7.
Figure 7.
Function testing of neutrophils from a homozygous carrier of the RASGRP2 mutation, a LAD-III patient, and control subjects. Neutrophils from a patient carrying homozygous RASGRP2 mutation, a LAD-III patient, and control subjects were isolated from blood. (a) NADPH oxidase activity revealed as hydrogen peroxide production (nmol/min) in response to stimuli (left). Maximal activities were measured over 30 min of incubation; STZ, serum-treated zymosan; PAF, platelet activating factor; fMLP, formyl-Met-Leu-Phe. The middle panel shows neutrophil adhesion to fibronectin upon activation. The right panel shows neutrophil chemotaxis. Results were expressed as relative fluorescence unit (NADPH oxidase activity data were obtained from 18 independent experiments; adhesion data were from 8–13 independent tests and chemotaxis from 7–9). Data are expressed as means ± SEM (Student’s t test; ***, P < 0.001). (b) Neutrophils adhesion (left) and transmigration (right) on TNF-activated HUVECs under flow conditions (2 dynes/cm2). Control neutrophils originate from either local healthy individual (Ctl1) or from blood shipped in the same manner as the patients’ samples (Ctl2). Results are expressed as mean ± SEM; n = 3.

Comment in

Similar articles

Cited by

References

    1. Alon R., Aker M., Feigelson S., Sokolovsky-Eisenberg M., Staunton D.E., Cinamon G., Grabovsky V., Shamri R., Etzioni A. 2003. A novel genetic leukocyte adhesion deficiency in subsecond triggering of integrin avidity by endothelial chemokines results in impaired leukocyte arrest on vascular endothelium under shear flow. Blood. 101:4437–4445 10.1182/blood-2002-11-3427 - DOI - PubMed
    1. Aslan J.E., McCarty O.J. 2013. Rho GTPases in platelet function. J. Thromb. Haemost. 11:35–46 10.1111/jth.12051 - DOI - PMC - PubMed
    1. Bergmeier W., Goerge T., Wang H.W., Crittenden J.R., Baldwin A.C., Cifuni S.M., Housman D.E., Graybiel A.M., Wagner D.D. 2007. Mice lacking the signaling molecule CalDAG-GEFI represent a model for leukocyte adhesion deficiency type III. J. Clin. Invest. 117:1699–1707 10.1172/JCI30575 - DOI - PMC - PubMed
    1. Bernardi B., Guidetti G.F., Campus F., Crittenden J.R., Graybiel A.M., Balduini C., Torti M. 2006. The small GTPase Rap1b regulates the cross talk between platelet integrin alpha2beta1 and integrin alphaIIbbeta3. Blood. 107:2728–2735 10.1182/blood-2005-07-3023 - DOI - PMC - PubMed
    1. Bertoni A., Tadokoro S., Eto K., Pampori N., Parise L.V., White G.C., Shattil S.J. 2002. Relationships between Rap1b, affinity modulation of integrin alpha IIbbeta 3, and the actin cytoskeleton. J. Biol. Chem. 277:25715–25721 10.1074/jbc.M202791200 - DOI - PubMed

Publication types

MeSH terms