. 2014 Jun 24;9(6):e100745.
doi: 10.1371/journal.pone.0100745. eCollection 2014.

Haptoglobin is required to prevent oxidative stress and muscle atrophy

Affiliations

Haptoglobin is required to prevent oxidative stress and muscle atrophy

Enrico Bertaggia et al. PLoS One. .

Abstract

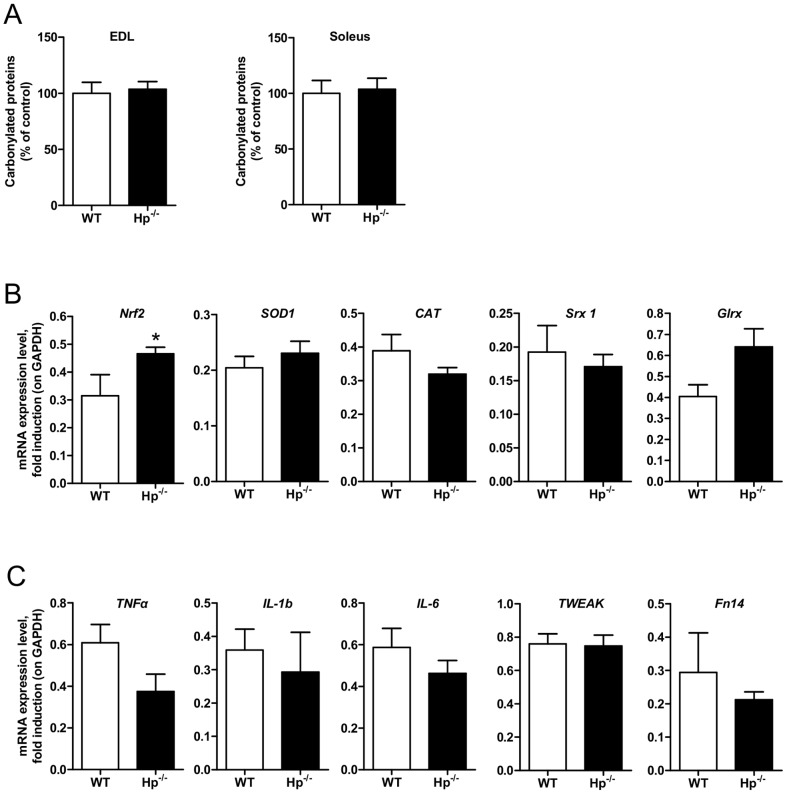
Background: Oxidative stress (OS) plays a major role on tissue function. Several catabolic or stress conditions exacerbate OS, inducing organ deterioration. Haptoglobin (Hp) is a circulating acute phase protein, produced by liver and adipose tissue, and has an important anti-oxidant function. Hp is induced in pro-oxidative conditions such as systemic inflammation or obesity. The role of systemic factors that modulate oxidative stress inside muscle cells is still poorly investigated.

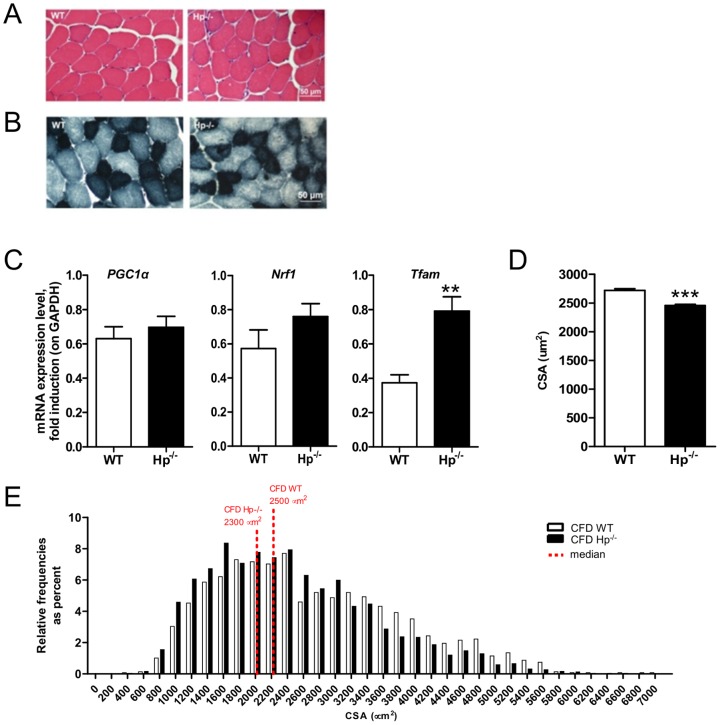
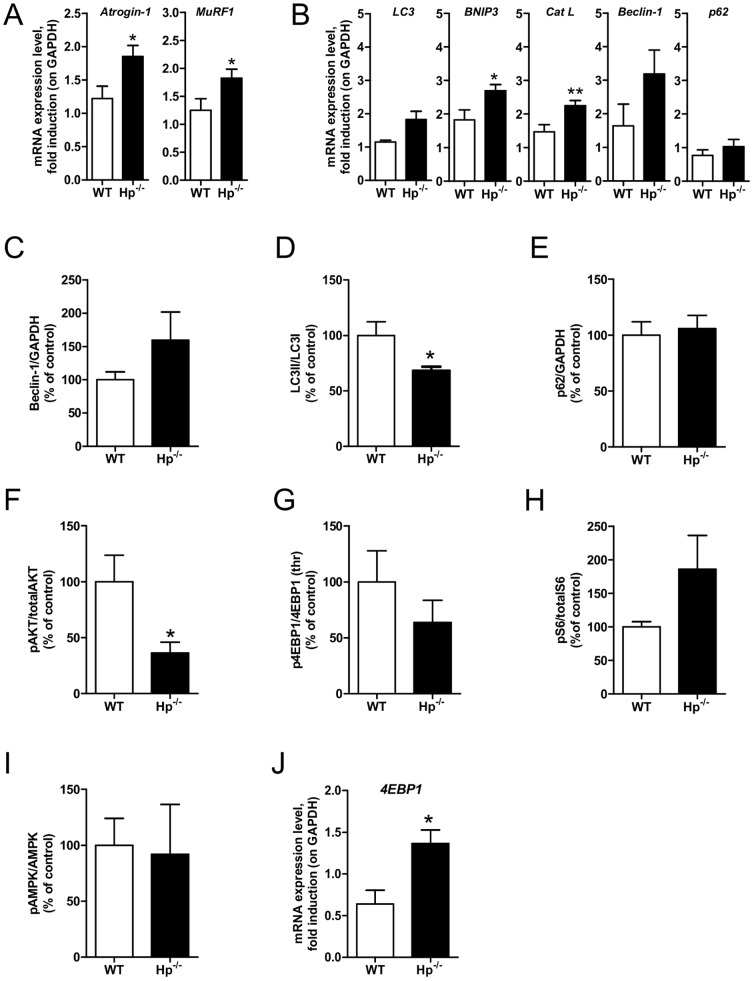
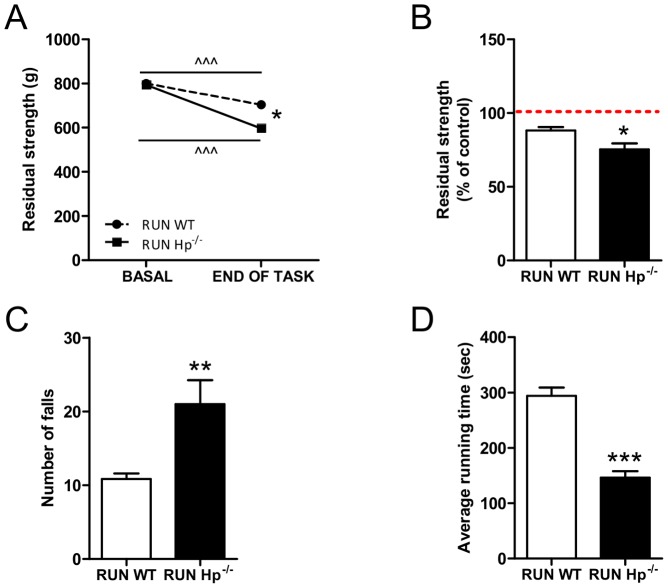
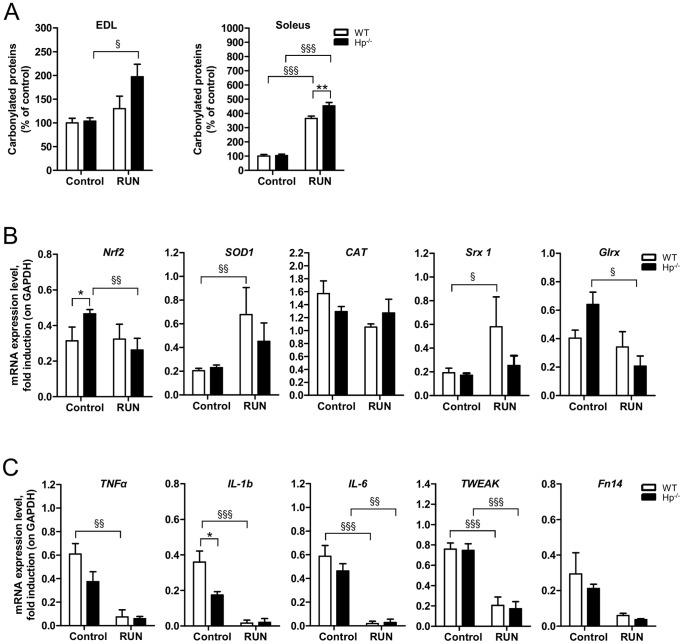
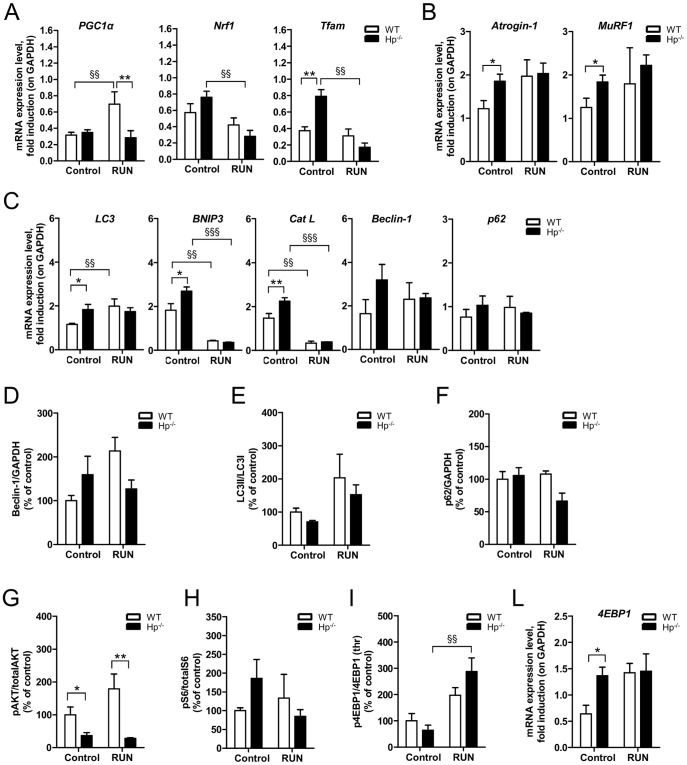
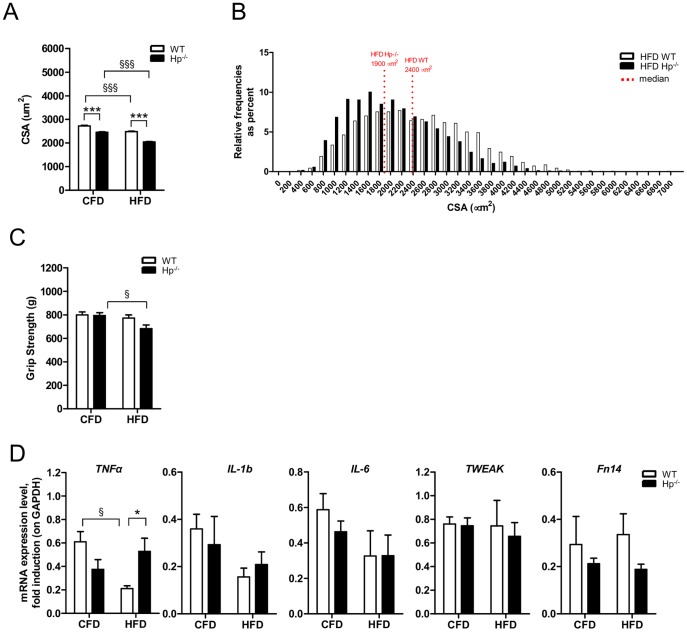
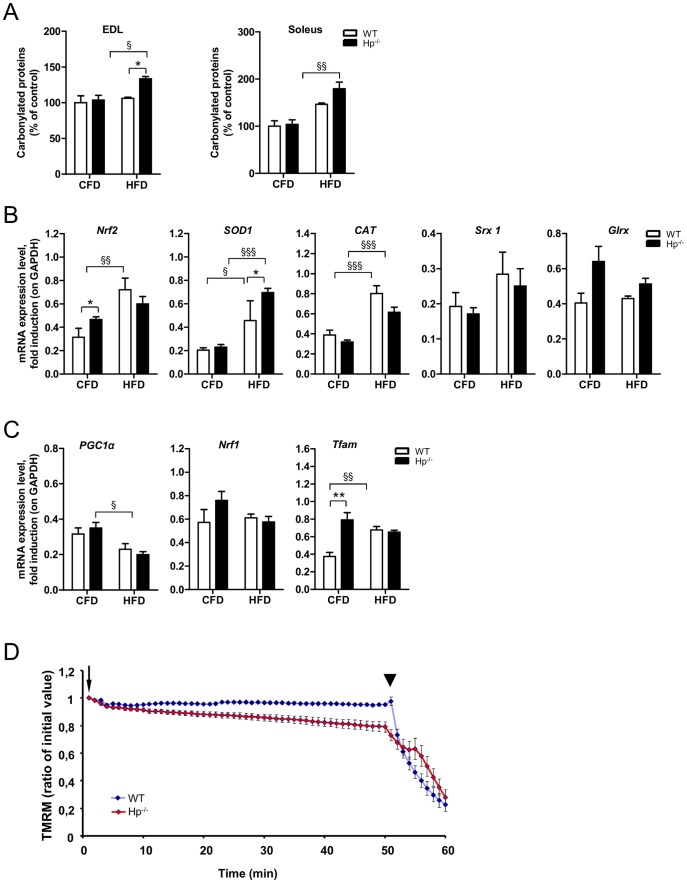
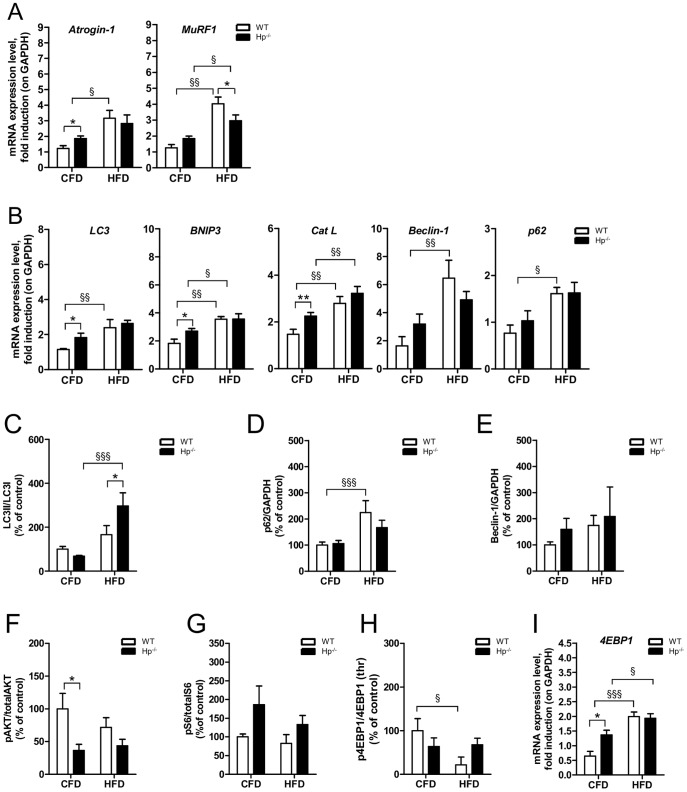
Results: We used Hp knockout mice (Hp-/-) to determine the role of this protein and therefore, of systemic OS in maintenance of muscle mass and function. Absence of Hp caused muscle atrophy and weakness due to activation of an atrophy program. When animals were stressed by acute exercise or by high fat diet (HFD), OS, muscle atrophy and force drop were exacerbated in Hp-/-. Depending from the stress condition, autophagy-lysosome and ubiquitin-proteasome systems were differently induced.

Conclusions: Hp is required to prevent OS and the activation of pathways leading to muscle atrophy and weakness in normal condition and upon metabolic challenges.


Conflict of interest statement

Competing Interests: The authors have declared that no competing interests exist.

Figures

Figure 1
Figure 1. Haptoglobin deficiency effect on protein carbonylation, antioxidant response and inflammatory response in the skeletal muscle.
A) Protein carbonylation is similar in EDL and soleus muscle of WT and Hp-/- mice (n = 11). B) mRNA analysis for anti-oxidant response (names of genes as indicated) in Tibialis anterior muscle of WT and Hp-/- mice (n = 8). C) mRNA analysis for inflammatory response (names of genes as indicated) in Tibialis anterior muscle of WT and Hp-/- mice (n = 8). Data are expressed as mean ± SEM. Student's t-test: *P<0.05.
Figure 2
Figure 2. Haptoglobin deficiency induces muscle atrophy in skeletal muscle.
A) Hematoxylin and Eosin staining of WT and Hp-/- Tibialis anterior muscle shows no sign of fiber degeneration and/or inflammation. B) Succinate Dehydrogenase (SDH) staining of WT and Hp-/- Tibialis anterior muscle shows no major differences of fiber types. C) mRNA expression levels of PGC1α, Nrf1 and Tfam in Tibialis anterior of WT and Hp-/- mice (n = 8). D) Cross sectional area (CSA) of Tibialis anterior is reduced in Hp-/- (10%) as compared to WT mice (n≥2500 fibers). Muscles were dissected from 5 months old mice. E) Cross sectional area (CSA) frequency distribution of Tibialis anterior in Hp-/- and WT mice. The bar graph represents relative frequencies as percent. Red-dotted lines indicates the median for each distribution (n≥2500 fibers). Data are expressed as mean ± SEM. Student's t-test: **P<0.01; ***P<0.001.
Figure 3
Figure 3. Haptoglobin deficiency induces activation of the ubiquitin-proteasome system and inhibition of protein synthesis in the skeletal muscle.
A) Atrogin-1 and Murf1 mRNA transcripts are increased in Hp-/- as compared to WT skeletal muscle. B) mRNA expression levels of autophagy related genes (names of genes as indicated) in the skeletal muscle of WT and Hp-/- mice. (C-I) Western blots analysis on protein isolated from skeletal muscle of WT and Hp-/- mice showing: C) Beclin-1 protein levels, D) LC3 lipidation, E) p62 protein levels, F) Akt phosphorylation (ratio between signal on Ser 473 and total Akt), G) 4EBP1 phosphorylation (ratio between signal on Thr 37/46 and total 4EBP1), H) S6 phosphorylation (ratio between signal on Ser 235/236 and total p70S6), I) AMPK phosphorylation (ratio between Thr172 and total AMPK). The bar graphs represent the quantification of the sum of experiments; data are expressed as percentage of “WT”, where WT is considered 100%. J) mRNA expression levels of 4EBP1. Real time PCR and Western Blot analyses were respectively performed on Tibialis anterior cDNA (n = 8) and Gastrocnemius muscle lysates (n = 6). GAPDH is used as control of equal loading in both cases. Muscles were dissected from 5 months old mice. Data are expressed as mean ± SEM. Student's t-test: *P<0.05; **P<0.01.
Figure 4
Figure 4. Haptoglobin deficiency affects muscle performance.
A) and B) Forelimbs strength assessment by grip test. A) WT and Hp-/- mice show overlapping basal strength; following rotarod exercise (end of task) Hp-/- undergo a more pronounced strength reduction as compared to WT. B) residual strength, expressed as percentage of basal strength before the exercise (dashed line) is lower in Hp-/- as compared to WT mice. C) Number of falls/hour from rotarod is higher in Hp-/- mice (RUN Hp-/-) as compared to controls (RUN WT). D) The average consecutive time that mice spent on rotarod is significantly shorter in RUN Hp-/- as compared to controls (RUN WT) (n = 8). Data are expressed as mean ± SEM. Student's t-test: *P<0.05; **P<0.01; ***P<0.001. Paired Student's t-test: ∧∧∧P<0.001.
Figure 5
Figure 5. Following acute exercise Haptoglobin deficiency results in exacerbated oxidative stress and impaired antioxidant response.
Each panel shows WT (white bars) and Hp-/- (black bars) skeletal muscle in resting conditions (the same as figures 1 and 2, referred to as control, n = 6–8) and following 3 hours of rotarod exercise (referred to as “RUN”, n = 6). A) The exercise dependent increase in carbonylated proteins is more pronounced in the EDL and Soleus muscle of Hp-/- as compared to WT mice. B) mRNA analysis for anti-oxidant response (names of genes as indicated) in Tibialis anterior muscle. C) mRNA analysis for inflammatory response (names of genes as indicated) in Tibialis anterior muscle. Data are expressed as mean ± SEM. *P<0.05; **P<0.01; §P<0.05; §§P<0.01; §§§P<0.001.
Figure 6
Figure 6. Following acute exercise Haptoglobin deficiency results in altered mitochondrial signaling in skeletal muscle.
A) mRNA analysis for mitochondrial biogenesis (names of genes as indicated): PGC1α transcript is induced by exercise in WT mice and not in Hp-/-; Tfam and Nrf1 are downregulated by exercise in Hp-/- skeletal muscle. B) Exercise does not affect Atrogin-1 and MuRF1 mRNA levels in any of the two genotypes. C) mRNA amount of autophagy related genes (names as indicated) in control and RUN WT and Hp-/- skeletal muscle. (D-I) Quantification of Western blots analysis on protein isolated from skeletal muscle of control and RUN WT and Hp-/- mice; data are expressed as percentage of “control WT”, where control WT is considered 100%. D) Beclin-1 protein levels, E) LC3 lipidation (ANOVA treatment effect P<0.05), F) p62 protein levels, G) Akt phosphorylation (ratio between signal on Ser 473 and total Akt), H) S6 phosphorylation (ratio between signal on Ser 235/236 and total p70S6), I) 4EBP1 phosphorylation (ratio between signal on Thr 37/46 and total 4EBP1). J) 4EBP1 mRNA level. Real Time PCR and western blot analysis were respectively performed on Tibialis anterior cDNA and Gastrocnemius muscles protein lysates. GAPDH is used as control of equal loading in both cases. Muscles were dissected from 5 months old mice. Data are expressed as mean ± SEM. *P<0.05; **P<0.01; §§P<0.01; §§§P<0.001.
Figure 7
Figure 7. The effects of obesity on skeletal muscle size and performance in the absence of Haptoglobin.
Each panel shows WT (white bars) and Hp-/- (black bars) skeletal muscle under regular Chow Food Diet Feeding (the same as figures 1, 2 and 3, referred to as “CFD”, n = 6–8) and in the obesity condition following 12 weeks of High Fat Diet (referred to as “HFD”, n = 6). A) Hp deficiency exacerbates the obesity dependent reduction of Tibialis anterior cross sectional area (CSA) (n≥5000 fibers). B) Cross sectional area (CSA) frequency distribution of Tibialis anterior in obese Hp-/- and WT mice. The bar graph indicates relative frequencies as percent. Red-dotted lines indicates the median for each distribution (n≥5000 fibers). C) Grip test assessment of forelimbs strength reveals an obesity dependent reduction only in Hp-/- mice. D) mRNA analysis for inflammatory response (names of genes as indicated) in Tibialis anterior muscle. Data are expressed as mean ± SEM. *P<0.05; ***P<0.001, §P<0.05; §§§P<0.001.
Figure 8
Figure 8. The effect of obesity on protein carbonylation, antioxidant response and mitochondrial function in the absence of Haptoglobin.
Each panel shows WT (white bars) and Hp-/- (black bars) skeletal muscle under regular Chow Food Diet Feeding (the same as figures 1, 2 and 3, referred to as “CFD”, n = 6–8) and in the obesity condition following 12 weeks of High Fat Diet (referred to as “HFD”, n = 6). A) Oxyblot reveals an obesity dependent increase in carbonylated proteins in the EDL and Soleus muscle of Hp-/- mice. B) mRNA analysis for anti-oxidant response (names of genes as indicated) in Tibialis anterior muscle. C) mRNA analysis for mitochondrial biogenesis (names of genes as indicated) in the skeletal muscle: obesity dependent down regulation of PGC1α in HFD Hp-/- mice, and Tfam upregulation in HFD WT animals. D) Mitochondrial response to oligomycin in single myofibers isolated from flexor digitorum brevis (FDB) skeletal muscles of WT and Hp-/- mice. Where indicated, 6 µM oligomycin (arrow) or 4 µM of the protonophore carbonylcyanide-p-trifluoromethoxyphenyl hydrazone (FCCP) (arrowhead) were added. Traces represent tetramethylrhodamine methyl ester (TMRM) fluorescence as the mean of all the fibers of a group (n≥12). Fibers are considered as depolarized when they lose more than 10% of initial value of TMRM fluorescence after oligomycin addition. mRNA analysis and histological assessment are performed on Tibialis anterior skeletal muscle. Data are expressed as mean ± SEM. *P<0.05; **P<0.01; §P<0.05; §§P<0.01; §§§P<0.001.
Figure 9
Figure 9. The effects of obesity on skeletal muscle protein balance in the absence of Haptoglobin.
Each panel shows WT (white bars) and Hp-/- (black bars) skeletal muscle under regular Chow Food Diet Feeding (the same as figures 1, 2 and 3, referred to as “CFD”, n = 6–8) and in the obesity condition following 12 weeks of High Fat Diet (referred to as “HFD”, n = 6). A) Obesity results in Atrogin-1 transcript upregulation in HFD WT mice and in MuRF1 transcript upregulation both in HFD WT and HFD Hp-/- mice. B) mRNA levels of autophagy related genes (names as indicated) in CFD and HFD WT and Hp-/- skeletal muscle. (C-H) Quantification of Western blot analysis on skeletal muscle of CFD and HFD WT and Hp-/- mice; data are expressed as percentage of “CFD WT”, where CFD WT is considered 100%. C) LC3 lipidation, D) p62 protein levels, E) Beclin-1 protein levels, F) Akt phosphorylation (ratio between signal on Ser 473 and total AKT), G) S6 phosphorylation (ratio between signal on Ser 240/244 and total p70S6), H) 4EBP1 phosphorylation (ratio between signal on Thr 37/46 and total 4EBP1). I) 4EBP1 mRNA level is increased in both obese WT and HFD Hp-/- skeletal muscle with respect to relative CFD. Real Time PCR and western blot analysis were respectively performed on Tibialis anterior cDNA and Gastrocnemius muscles protein lysates. GAPDH is used as control of equal loading in both cases. Muscles were dissected from 5 months old mice. Data are expressed as mean ± SEM. *P<0.05; **P<0.01; §P<0.05; §§P<0.01; §§§P<0.001.

References

    1. Dobryszycka W (1997) Biological functions of haptoglobin—new pieces to an old puzzle. Eur J Clin Chem Clin Biochem 35: 647–654. - PubMed
    1. Chiellini C, Bertacca A, Novelli SE, Gorgun CZ, Ciccarone A, et al. (2002) Obesity modulates the expression of haptoglobin in the white adipose tissue via TNFalpha. J Cell Physiol 190: 251–258. - PubMed
    1. Kristiansen M, Graversen JH, Jacobsen C, Sonne O, Hoffman HJ, et al. (2001) Identification of the haemoglobin scavenger receptor. Nature 409: 198–201. - PubMed
    1. Farbstein D, Blum S, Pollak M, Asaf R, Viener HL, et al. (2011) Vitamin E therapy results in a reduction in HDL function in individuals with diabetes and the haptoglobin 2–1 genotype. Atherosclerosis 219: 240–244. - PMC - PubMed
    1. Lim SK, Kim H, Lim SK, bin Ali A, Lim YK, et al. (1998) Increased susceptibility in Hp knockout mice during acute hemolysis. Blood 92: 1870–1877. - PubMed

Publication types

MeSH terms

LinkOut - more resources