. 2014 Jun 24;9(6):e100156.
doi: 10.1371/journal.pone.0100156. eCollection 2014.

Assessing binocular interaction in amblyopia and its clinical feasibility

Affiliations

Assessing binocular interaction in amblyopia and its clinical feasibility

MiYoung Kwon et al. PLoS One. .

Abstract

Purpose: To measure binocular interaction in amblyopes using a rapid and patient-friendly computer-based method, and to test the feasibility of the assessment in the clinic.

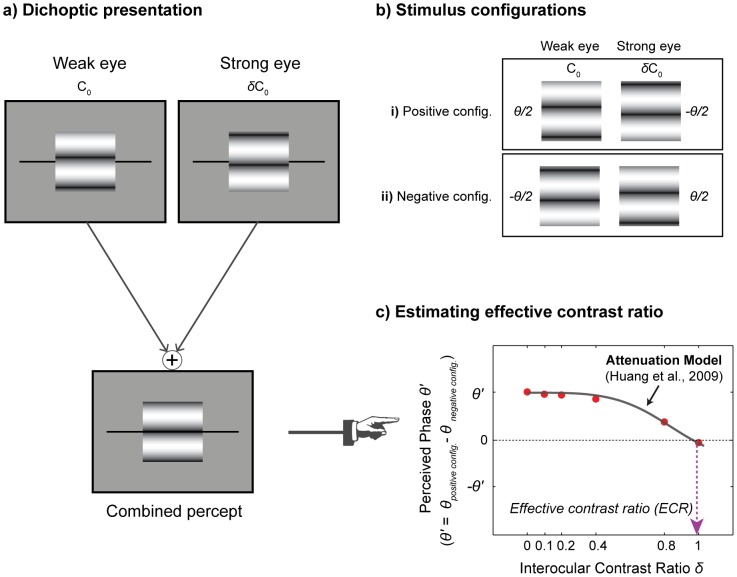
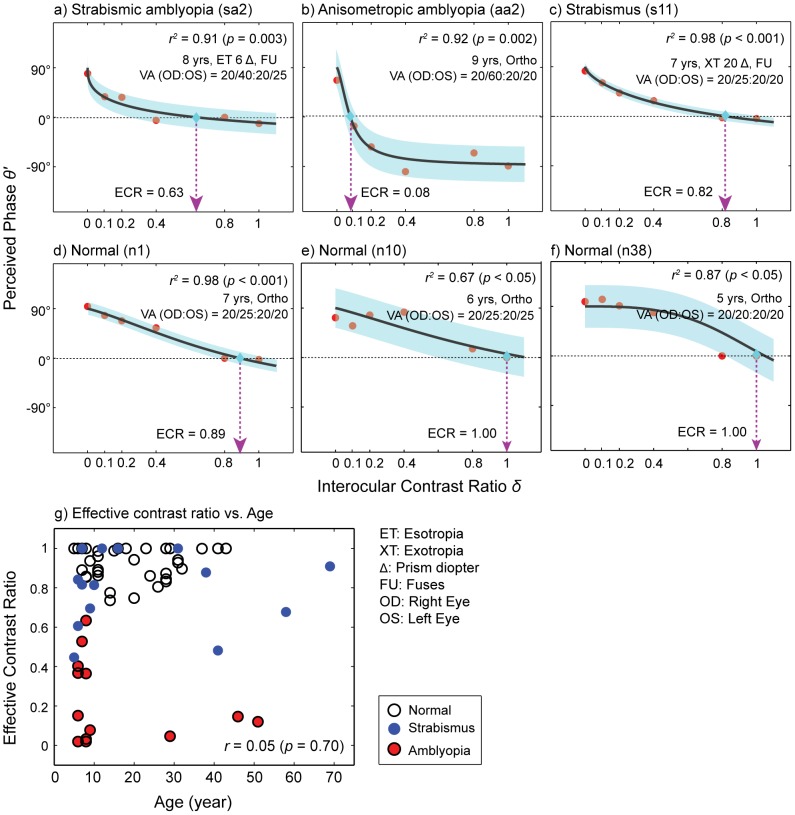
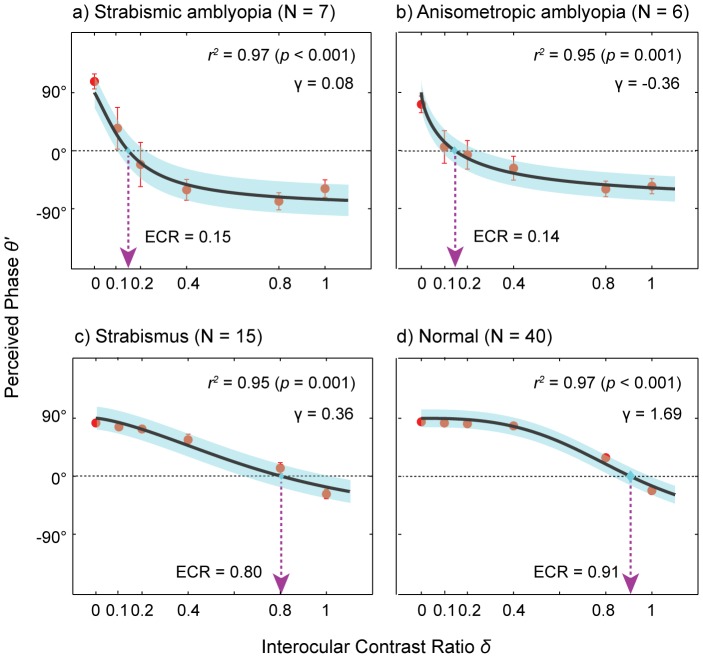
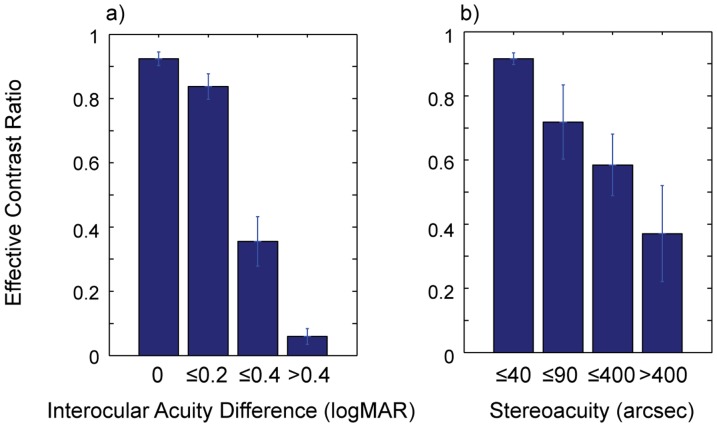
Methods: Binocular interaction was assessed in subjects with strabismic amblyopia (n = 7), anisometropic amblyopia (n = 6), strabismus without amblyopia (n = 15) and normal vision (n = 40). Binocular interaction was measured with a dichoptic phase matching task in which subjects matched the position of a binocular probe to the cyclopean perceived phase of a dichoptic pair of gratings whose contrast ratios were systematically varied. The resulting effective contrast ratio of the weak eye was taken as an indicator of interocular imbalance. Testing was performed in an ophthalmology clinic under 8 mins. We examined the relationships between our binocular interaction measure and standard clinical measures indicating abnormal binocularity such as interocular acuity difference and stereoacuity. The test-retest reliability of the testing method was also evaluated.

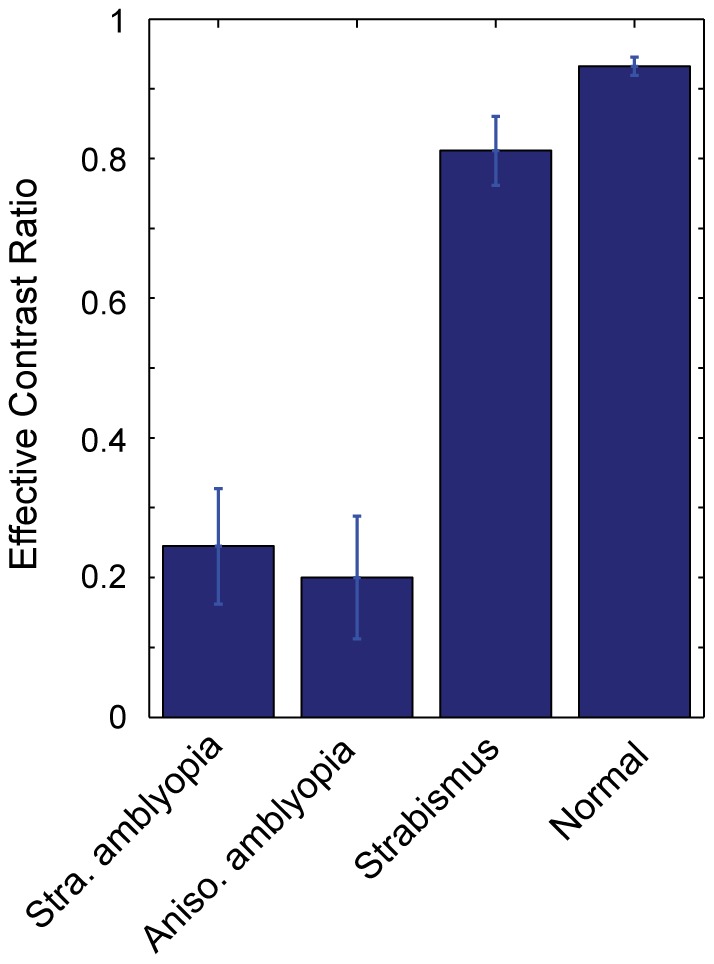
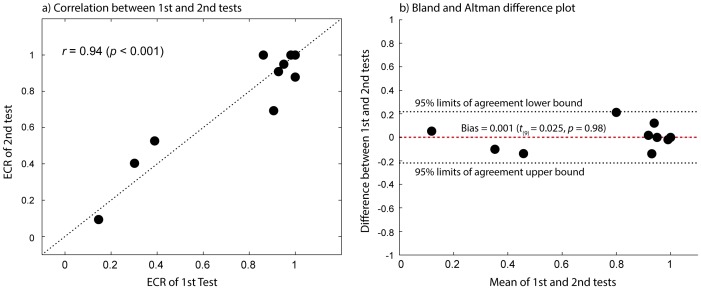
Results: Compared to normally-sighted controls, amblyopes exhibited significantly reduced effective contrast (∼20%) of the weak eye, suggesting a higher contrast requirement for the amblyopic eye compared to the fellow eye. We found that the effective contrast ratio of the weak eye covaried with standard clincal measures of binocular vision. Our results showed that there was a high correlation between the 1st and 2nd measurements (r = 0.94, p<0.001) but without any significant bias between the two.

Conclusions: Our findings demonstrate that abnormal binocular interaction can be reliably captured by measuring the effective contrast ratio of the weak eye and quantitative assessment of binocular interaction is a quick and simple test that can be performed in the clinic. We believe that reliable and timely assessment of deficits in a binocular interaction may improve detection and treatment of amblyopia.


Conflict of interest statement

Competing Interests: Peter Bex, a co-author of the manuscript, is a PLOS ONE Editorial Board member. However, this does not alter the authors' adherence to PLOS ONE editorial policies and criteria.

Figures

Figure 1
Figure 1. Schematic diagrams of stimulus configurations and task procedure.
(a) Illustration of dichoptic stimulus presentation; (b) Illustration of two stimulus configurations. In the positive configuration, the phase of the grating in the weak eye was shifted by θ/2 ( = 45°) from the midline while the phase in the strong eye was shifted by -θ/2. In the negative configuration, the phase-shift was reversed; (c) An example of the perceived phase (θ′) versus interocular contrast ratio δ. The perceived phase was measured as a function of interocular contrast ratio. The resulting data were fitted with the attenuation model to compute effective contrast ratio. The black solid line is the best fit of the model. The dotted arrow line (magenta) indicates the estimated effective contrast ratio for this normally-sighted subject.
Figure 2
Figure 2. Examples of individual subject data.
Each panel contains the perceived phase versus interocular contrast ratio function (red circles) of a representative subject from each group. Subject's age, angular eye deviation (type and amount of deviation), fixational information (fuses, left or right eye) and visual acuity are also shown in each panel. The data were fitted with the attenuation model (Eq. 4) to estimate effective contrast ratio (ECR) of the weak eye. The black solid lines are the best fits of the model. The dotted arrow lines (magenta color) indicate estimated effective contrast ratios. Shaded areas represent ±1 Standard Error of the Mean (SEM) of the fits. The goodness-of-fit was assessed with the r2 statistic. (a) An individual with strabismic amblyopia (8 yrs, ET 6Δ, Fuses); (b) An individual with anisometropic amblyopia (9 yrs, ortho); (c) An individual with strabismus (7 yrs, XT 20Δ, Fuses); (d) A normally-sighted individual (7 yrs, ortho); (e) A normally-sighted individual (6 yrs, ortho); (f) A normally-sighted individual (5 yrs, ortho); (g) Correlation between effective contrast ratio and age (year). *ET: Esotropia, XT: Exotropia, Δ: Prism diopter, FU: Fuses, OD: Right eye, OS: Left eye. Note that the reported ocular deviation and fixational information are those made at near fixation (see Figs S1 and S2 for the data from all individual subjects).
Figure 3
Figure 3. Mean effective contrast ratios for the four subject groups.
Mean effective contrast ratio as a function of subject group. Error bars represent ±1 Standard Errors of the Mean (SEM).
Figure 4
Figure 4. Group average data.
Perceived phase plotted as a function of interocular contrast ratio for each subject group. The bootstrap resampling method was performed to estimate the mean and standard errors of the data for each subject group. Each panel contains the average data (red circles) from each subject group. The average data were fitted with the attenuation model (Eq. 4) to obtain the effective contrast ratio of the weak eye. The black solid lines are the best fits of the model. The dotted arrow lines (magenta color) indicate estimated effective contrast ratios. Shaded areas represent ±1 SEM of the fits. The goodness-of-fit was evaluated by the r2 statistic: (a) Strabismic amblyopia; (b) Anisometropic amblyopia; (c) Strabismus; (d) Normal.
Figure 5
Figure 5. Relationships between effective contrast ratio and clinical binocular function measures.
(a) Mean effective contrast ratios for four levels of IAD in logMAR units; (b) Mean effective contrast ratios for four levels of stereoacuity in acrsec units. Error bars represent ±1 SEM.
Figure 6
Figure 6. Test-retest reliability.
(a) Correlation between 1st and 2nd tests. The dotted line indicates the line of equality (1st test  = 2nd test). Each black dot indicates a data point from each subject; (b) Difference in ECR between 1st test and 2nd test as a function of mean value of the two tests. Each black dot indicates a data point from each subject. The horizontal red dashed line represents a bias of the test, i.e., the mean difference value across subjects. The horizontal black dotted lines represent 95% limits of agreement.

References

    1. Hess RF, Campbell FW, Greenhalgh T (1978) On the nature of the neural abnormality in human amblyopia; Neural aberrations and neural sensitivity loss. Pflugers Arch 377: 201–207. - PubMed
    1. Simmons DR (2005) The binocular combination of chromatic contrast. Perception 34: 1035–1042. - PubMed
    1. Levi DM, Klein SA (1985) Vernier acuity, crowding and amblyopia. Vision Res 25: 979–991. - PubMed
    1. Hess RF, Howell ER (1977) The threshold contrast sensitivity function in strabismic amblyopia: Evidence for a two type classification. Vision Res 17: 1049–1055. - PubMed
    1. Hess RF, Mcllhagga W, Field D (1997) Contour integration in strabismic amblyopia: the sufficiency of explanation based on positional uncertainty. Vision Res 37: 3145–3161. - PubMed

Publication types