. 2014 Jun 24;9(6):e100757.
doi: 10.1371/journal.pone.0100757. eCollection 2014.

A new role for myosin II in vesicle fission

Affiliations

A new role for myosin II in vesicle fission

Juan A Flores et al. PLoS One. .

Abstract

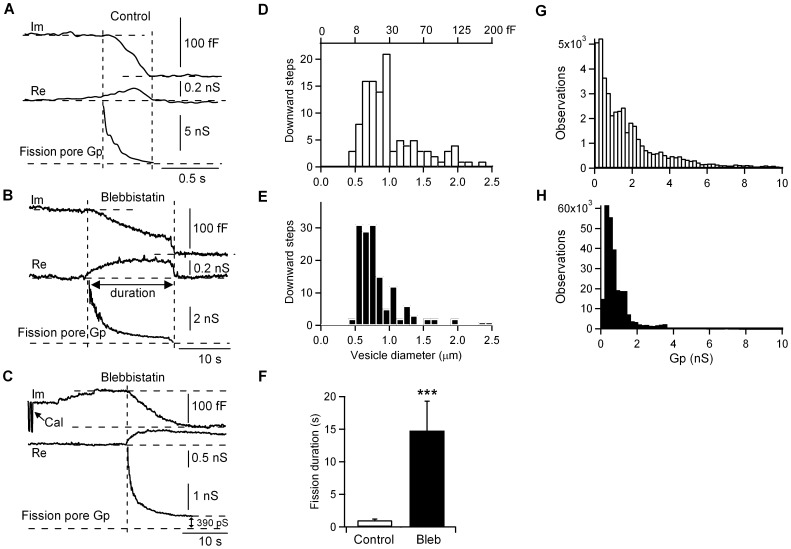
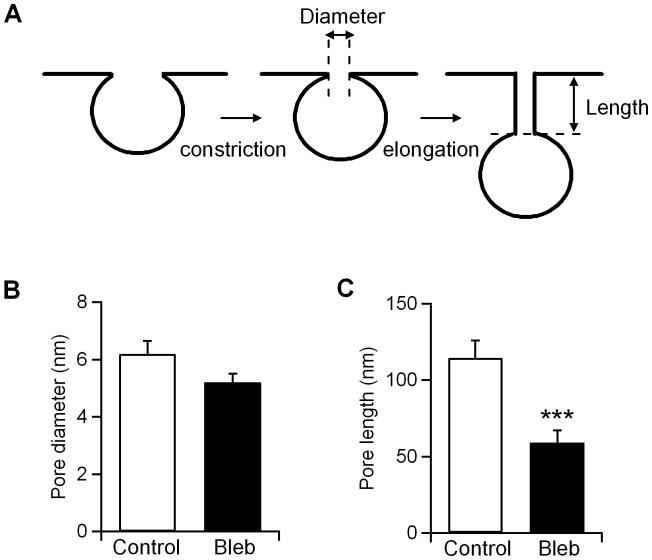
An endocytic vesicle is formed from a flat plasma membrane patch by a sequential process of invagination, bud formation and fission. The scission step requires the formation of a tubular membrane neck (the fission pore) that connects the endocytic vesicle with the plasma membrane. Progress in vesicle fission can be measured by the formation and closure of the fission pore. Live-cell imaging and sensitive biophysical measurements have provided various glimpses into the structure and behaviour of the fission pore. In the present study, the role of non-muscle myosin II (NM-2) in vesicle fission was tested by analyzing the kinetics of the fission pore with perforated-patch clamp capacitance measurements to detect single vesicle endocytosis with millisecond time resolution in peritoneal mast cells. Blebbistatin, a specific inhibitor of NM-2, dramatically increased the duration of the fission pore and also prevented closure during large endocytic events. Using the fluorescent markers FM1-43 and pHrodo Green dextran, we found that NM-2 inhibition greatly arrested vesicle fission in a late phase of the scission event when the pore reached a final diameter of ∼ 5 nm. Our results indicate that loss of the ATPase activity of myosin II drastically reduces the efficiency of membrane scission by making vesicle closure incomplete and suggest that NM-2 might be especially relevant in vesicle fission during compound endocytosis.


Conflict of interest statement

Competing Interests: The authors have declared that no competing interests exist.

Figures

Figure 1
Figure 1. Inhibition of NM-2 activity through acute blebbistatin treatment slows the kinetics of exocytosis and endocytosis.
Representative traces of capacitance steps from a control (A) and blebbistatin-treated cell (B). Re and Im represent the real and imaginary parts, respectively, of the admittance change. The steps labelled 1–4 at higher magnification show single downward steps, upwards steps and capacitance flickers (arrows). The kinetic parameters of the capacitance steps demonstrate that blebbistatin treatment affects the rise time (C) and upward-slope (D) to prolong the duration of the exocytic event. Blebbistatin also produces a increase in the decay time (E) without significantly affecting the downward-slope (F). The proportion of capacitance flickers (reversible fusion) decreased in blebbistatin-treated cells versus control cells (G) (p<0.05). Error bars, S.E.M. ***p<0.01.
Figure 2
Figure 2. Effects of the NM-2 inhibitor blebbistatin on fusion pore kinetics in mast cells.
Representative fusion pore events from control cells (A) and cells treated with 5 µM blebbistatin (B). The traces from top to bottom are the time course of the imaginary part of the admittance change (Im), the real part of the admittance change (Re) and the fusion pore conductance (Gp). The horizontal and vertical dashed lines indicate the baselines of the respective signals and the duration of the fusion pore, respectively. The mean capacitance step size of the endocytic vesicles was indistinguishable between control cells and cells treated with 5 µM blebbistatin (control: n = 547 events; blebbistatin: n = 582 events; p>0.05). Cv, vesicle capacitance (C). A fusion pore analysis demonstrated that treatment with 5 µM blebbistatin decreased the fusion pore conductance Gp (D) and increased the fusion pore duration (E) (control: n = 35 pores; blebbistatin: n = 30 pores). Error bars, S.E.M. *p<0.05; **p<0.01.
Figure 3
Figure 3. Effects of the NM-2 inhibitor blebbistatin on fission pore kinetics in mast cells.
Representative fission pore events from control cells (A) and cells treated with 5 µM blebbistatin (B, C). The traces from top to bottom are the time course of the imaginary part of the admittance change (Im), the real part of the admittance change (Re) and the fission pore conductance (Gp). The horizontal and vertical dashed lines indicate the baselines of the respective signals and the duration of the fission pore, respectively. Two types of individual endocytic events were detected using perforated-patch capacitance measurements under NM-2 inhibition: a long event with detectable membrane scission (B) and an endocytic event without detectable pore closure, i.e., when a vesicle tries to undergo fission without closing completely (C). The change in the real trace during this type of event cannot be the result of an incorrect phase setting as demonstrated by the separation of Im and Re during a pure capacitance increase of 100 fF that was applied for online phase calibration (start of Im trace; Cal). The distribution of vesicle diameters were derived from endocytic capacitance step sizes from control cells (D, white) and blebbistatin-treated cells (E, black). Large downward steps associated with the retrieval of large areas of membrane (greater than one vesicle) were largely abolished (control: n = 124 events; blebbistatin: n = 148 events). Blebbistatin produced an increase in the fission pore duration compared to control cells (F). Frequency distribution of Gp values during fission pore closure of endocytic events from control cells (G, white) and blebbistatin-treated cells (H, black). Error bars, S.E.M. ***p<0.001.
Figure 4
Figure 4. Blebbistatin affects fission pore dynamics.
The time–course of Gp showed three different kinetic phases in control cells (A). A double exponential function depicts the two initial phases (red dashed line). A more pronounced Gp decrease accounts for the third phase (not appreciable in this magnification). This last phase is not present in the fission pore from the cell treated with blebbistatin (B). Fission pore diameters (Dp) from control (C) and treated cells (D) were calculated from the conductance data with the assumption that all conductance decreases result from changes in the diameter (assuming a pore length of 15 nm, which corresponds to the thickness of two membrane bilayers). A time–course of fission pore resistance (Rp) was calculated from the conductance data (E and F). The second phase could be fitted to a straight line in both the control pore (E) and the pore inhibited with blebbistatin (F) (dashed line; Pearson’s correlation coefficients: 0.89 and 0.95, respectively). The sudden increase in pore resistance indicated that the final pore closure (third phase) was absent from the pores in most cells lacking NM-2 function. The pore closure rates during the first (G) and second (H) phases in control conditions were higher than blebbistatin-treated pores. Error bars, S.E.M. *p<0.05; ***p<0.001.
Figure 5
Figure 5. Inhibition of NM-2 activity through drug treatments produces decreased FM1-43 internalization.
The standard protocol begins with an initial FM1-43 (4 µM) perfusion to label cells, followed by perfusion of C48/80 (100 µg/ml) in the presence of FM1-43 to stimulate secretion for 15 min. Finally, the extracellular FM1-43 label was removed by washing with a standard solution for 15 min (A). Cells that were treated with blebbistatin (5 µM) or ML-7 (5 µM) were previously incubated in a solution containing these drugs for 10 min. Panel A shows FM1-43 fluorescence images taken from control (Control) and Blebbistatin- (Bleb) or ML-7 (ML-7)-treated cells. From left to right: basal (1), at the beginning of the exocytosis (2), at the end of the exocytosis (3) and after removal of the extracellular dye (4). Internalized dye-labelled endocytic vesicles are evident as fluorescent spots within each cell (4). Mean fluorescence (arbitrary units, a.u.) data showing that basal and exocytic fluorescence (white bar, control; black bar, blebbistatin; and lined bar, ML-7) are equal for treated and non-treated cells. However, endocytic fluorescence was significantly lower for cells treated with blebbistatin or ML-7 (B). Scale bar: 5 µm. Error bars, S.E.M. ***p<0.001.
Figure 6
Figure 6. Compound endocytosis is inhibited by blebbistatin.
The left images show brightfield single confocal sections, while the right images show Z-stack projections of endocytic spots labelled with FM1-43 (A). The data are from control cells (Control) and cells treated with blebbistatin (Bleb) (5 µM). In panel B, the upper pictures (1–4) show a sequence obtained gradually (at 2 µm separation) from the control cell shown in A. The lower pictures show an enlarged view of groups of endocytic vesicles (enclosed by a box in images 1–4) (B). A bar graph shows that the number of FM1-43 spots per cell in control (white) and blebbistatin conditions (black) was significantly different (C). The area of FM1-43 spots per cell was significantly reduced by blebbistatin (black) compared to control cells (white) (D). Histograms of the spot area for control conditions (E, white) and blebbistatin treatment (F, black). Scale bars: 5 and 1 (insets) µm. Error bars, S.E.M. *p<0.05; ***p<0.001.
Figure 7
Figure 7. NM-2 inhibition blocks membrane scission and promotes unclosed vesicles through a narrow neck.
Schematic of endocytic spots labelled with FM1-43 and pHrodo Green (A). After addition, the dyes incorporate into exocytic vesicles, which fuse with the membrane upon a stimulus (C48/80). If these vesicles are internalized and acidified, the vesicles will be stained. Therefore, after removing the extracellular dyes, only fluorescent endocytic vesicles remained. The addition of an extracellular acidic solution reveals the presence of uncompleted fission pores. The images in panel B show Z-stack projections from control cells (Control) or cells treated with blebbistatin (5 µM) (Bleb) at pH 7.25 or pH 5.5 after stimulation by C48/80 (100 µg/ml) (B). The stainings from left to right are: FM1-43 (red), pHrodo Green dextran (green) and a merge of FM1-43 and pHrodo Green dextran. The mean number of FM1-43 (black) and pHrodo Green dextran (grey) spots per cell in control conditions at pH 7.25 or pH 5.5 and after treatment with blebbistatin at pH 7.25 or pH 5.5 (C). Scale bar: 5 µm. Error bars, S.E.M. ***p<0.001.
Figure 8
Figure 8. Blebbistatin affects fission pore geometry.
A good model for explaining the dynamics of the fission pore is to assume that a decrease in pore diameter occurs initially (first phase) and is followed by a lengthening of the fission pore (second phase) (A) . Assuming that successive steps of narrowing and lengthening explain the observed changes in pore resistance, we have calculated the final pore diameter (Dp final) and length (Lp final). No significant differences were found in the final pore diameter between control and blebbistatin-treated cells (B). However, NM-2 inhibition reduced pore length (C). All error bars represent the S.E.M. ***p<0.001.
Figure 9
Figure 9. Capacitance parameters.
The vertical distance at the step position defined the amplitude of ΔCm. The rise time (RT) or decay time (DT) shows the time required to reach the maximum or minimum amplitude, respectively, of the capacitance step, while the rate of membrane fusion and fission are measured as the slope of the linear fit to each upward (A) and downward (B) correspond to Su and Sd respectively (red dashed lines).

Similar articles

Cited by

References

    1. Metcalfe DD, Baram D, Mekori YA (1997) Mast cells. Physiol Rev 77: 1033–79. - PubMed
    1. Alvarez de Toledo G, Fernandez JM (1990) Compound versus multigranular exocytosis in peritoneal mast cells. J Gen Physiol 95: 397–409. - PMC - PubMed
    1. Rohlich P, Anderson P, Uvnas B (1971) Electron microscope observations on compounds 48-80-induced degranulation in rat mast cells. Evidence for sequential exocytosis of storage granules. J Cell Biol 51: 465–83. - PMC - PubMed
    1. Cabeza JM, Acosta J, Ales E (2013) Mechanisms of granule membrane recapture following exocytosis in intact mast cells. J Biol Chem 288: 20293–305. - PMC - PubMed
    1. Kaksonen M, Toret CP, Drubin DG (2006) Harnessing actin dynamics for clathrin-mediated endocytosis. Nat Rev Mol Cell Biol 7: 404–14. - PubMed

Publication types

MeSH terms

LinkOut - more resources