In vitro ischemia triggers a transcriptional response to down-regulate synaptic proteins in hippocampal neurons
- PMID: 24960035
- PMCID: PMC4069008
- DOI: 10.1371/journal.pone.0099958
In vitro ischemia triggers a transcriptional response to down-regulate synaptic proteins in hippocampal neurons
Abstract
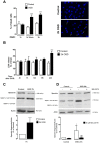
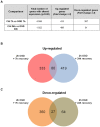
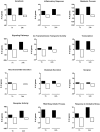
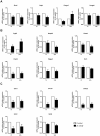
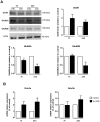
Transient global cerebral ischemia induces profound changes in the transcriptome of brain cells, which is partially associated with the induction or repression of genes that influence the ischemic response. However, the mechanisms responsible for the selective vulnerability of hippocampal neurons to global ischemia remain to be clarified. To identify molecular changes elicited by ischemic insults, we subjected hippocampal primary cultures to oxygen-glucose deprivation (OGD), an in vitro model for global ischemia that resulted in delayed neuronal death with an excitotoxic component. To investigate changes in the transcriptome of hippocampal neurons submitted to OGD, total RNA was extracted at early (7 h) and delayed (24 h) time points after OGD and used in a whole-genome RNA microarray. We observed that at 7 h after OGD there was a general repression of genes, whereas at 24 h there was a general induction of gene expression. Genes related with functions such as transcription and RNA biosynthesis were highly regulated at both periods of incubation after OGD, confirming that the response to ischemia is a dynamic and coordinated process. Our analysis showed that genes for synaptic proteins, such as those encoding for PICK1, GRIP1, TARPγ3, calsyntenin-2/3, SAPAP2 and SNAP-25, were down-regulated after OGD. Additionally, OGD decreased the mRNA and protein expression levels of the GluA1 AMPA receptor subunit as well as the GluN2A and GluN2B subunits of NMDA receptors, but increased the mRNA expression of the GluN3A subunit, thus altering the composition of ionotropic glutamate receptors in hippocampal neurons. Together, our results present the expression profile elicited by in vitro ischemia in hippocampal neurons, and indicate that OGD activates a transcriptional program leading to down-regulation in the expression of genes coding for synaptic proteins, suggesting that the synaptic proteome may change after ischemia.
Conflict of interest statement
Figures




Similar articles
-
Distinct subunit-specific α-amino-3-hydroxy-5-methyl-4-isoxazolepropionic acid (AMPA) receptor trafficking mechanisms in cultured cortical and hippocampal neurons in response to oxygen and glucose deprivation.J Biol Chem. 2014 Feb 21;289(8):4644-51. doi: 10.1074/jbc.M113.533182. Epub 2014 Jan 8. J Biol Chem. 2014. PMID: 24403083 Free PMC article.
-
Multiple domains in the C-terminus of NMDA receptor GluN2B subunit contribute to neuronal death following in vitro ischemia.Neurobiol Dis. 2016 May;89:223-34. doi: 10.1016/j.nbd.2015.11.007. Epub 2015 Nov 12. Neurobiol Dis. 2016. PMID: 26581639
-
PICK1-mediated glutamate receptor subunit 2 (GluR2) trafficking contributes to cell death in oxygen/glucose-deprived hippocampal neurons.J Biol Chem. 2009 May 22;284(21):14230-5. doi: 10.1074/jbc.M901203200. Epub 2009 Mar 25. J Biol Chem. 2009. PMID: 19321442 Free PMC article.
-
Differential regulation of the Rac1 GTPase-activating protein (GAP) BCR during oxygen/glucose deprivation in hippocampal and cortical neurons.J Biol Chem. 2017 Dec 8;292(49):20173-20183. doi: 10.1074/jbc.M117.796292. Epub 2017 Oct 18. J Biol Chem. 2017. PMID: 29046349 Free PMC article.
-
Investigating the mechanisms underlying neuronal death in ischemia using in vitro oxygen-glucose deprivation: potential involvement of protein SUMOylation.Neuroscientist. 2008 Dec;14(6):626-36. doi: 10.1177/1073858408322677. Neuroscientist. 2008. PMID: 19029060 Free PMC article. Review.
Cited by
-
Sulbactam Protects Hippocampal Neurons Against Oxygen-Glucose Deprivation by Up-Regulating Astrocytic GLT-1 via p38 MAPK Signal Pathway.Front Mol Neurosci. 2018 Aug 15;11:281. doi: 10.3389/fnmol.2018.00281. eCollection 2018. Front Mol Neurosci. 2018. PMID: 30158854 Free PMC article.
-
Tat-Endophilin A1 Fusion Protein Protects Neurons from Ischemic Damage in the Gerbil Hippocampus: A Possible Mechanism of Lipid Peroxidation and Neuroinflammation Mitigation as Well as Synaptic Plasticity.Cells. 2021 Feb 9;10(2):357. doi: 10.3390/cells10020357. Cells. 2021. PMID: 33572372 Free PMC article.
-
Acid-sensing ion channel 1a drives AMPA receptor plasticity following ischaemia and acidosis in hippocampal CA1 neurons.J Physiol. 2015 Oct 1;593(19):4373-86. doi: 10.1113/JP270701. Epub 2015 Aug 18. J Physiol. 2015. PMID: 26174503 Free PMC article.
-
Excitotoxic stimulation activates distinct pathogenic and protective expression signatures in the hippocampus.J Cell Mol Med. 2021 Sep;25(18):9011-9027. doi: 10.1111/jcmm.16864. Epub 2021 Aug 20. J Cell Mol Med. 2021. PMID: 34414662 Free PMC article.
-
Neuroprotective effect of grape seed extract on brain ischemia: a proteomic approach.Metab Brain Dis. 2019 Jun;34(3):889-907. doi: 10.1007/s11011-019-00396-2. Epub 2019 Feb 22. Metab Brain Dis. 2019. PMID: 30796716
References
-
- Papadopoulos MC, Giffard RG, Bell BA (2000) An introduction to the changes in gene expression that occur after cerebral ischaemia. Br J Neurosurg 14: 305–312. - PubMed
-
- Kawahara N, Wang Y, Mukasa A, Furuya K, Shimizu T, et al. (2004) Genome-wide gene expression analysis for induced ischemic tolerance and delayed neuronal death following transient global ischemia in rats. J Cereb Blood Flow Metab 24: 212–223. - PubMed
-
- Buttner F, Cordes C, Gerlach F, Heimann A, Alessandri B, et al. (2009) Genomic response of the rat brain to global ischemia and reperfusion. Brain Res 1252: 1–14. - PubMed
-
- Jin K, Mao XO, Eshoo MW, Nagayama T, Minami M, et al. (2001) Microarray analysis of hippocampal gene expression in global cerebral ischemia. Ann Neurol 50: 93–103. - PubMed
-
- Zukin RS, Jover T, Yokota H, Calderone A, Simionescu M, et al... (2004) Molecular and Cellular Mechanisms of Ischemia-Induced Neuronal Death. In: J. P. Mohr DWC, J. C Grotta, B Weir and P. A Wolf., editor. Stroke: Pathophysiology, Diagnosis, and Management Philadelphia: Elsevier, Inc. pp. 829–854.
Publication types
MeSH terms
Substances
LinkOut - more resources
Full Text Sources
Other Literature Sources
Molecular Biology Databases

