

Decreased camptothecin sensitivity of the stem-cell-like fraction of Caco2 cells correlates with an altered phosphorylation pattern of topoisomerase I
- PMID: 24960044
- PMCID: PMC4069021
- DOI: 10.1371/journal.pone.0099628
Decreased camptothecin sensitivity of the stem-cell-like fraction of Caco2 cells correlates with an altered phosphorylation pattern of topoisomerase I
Abstract
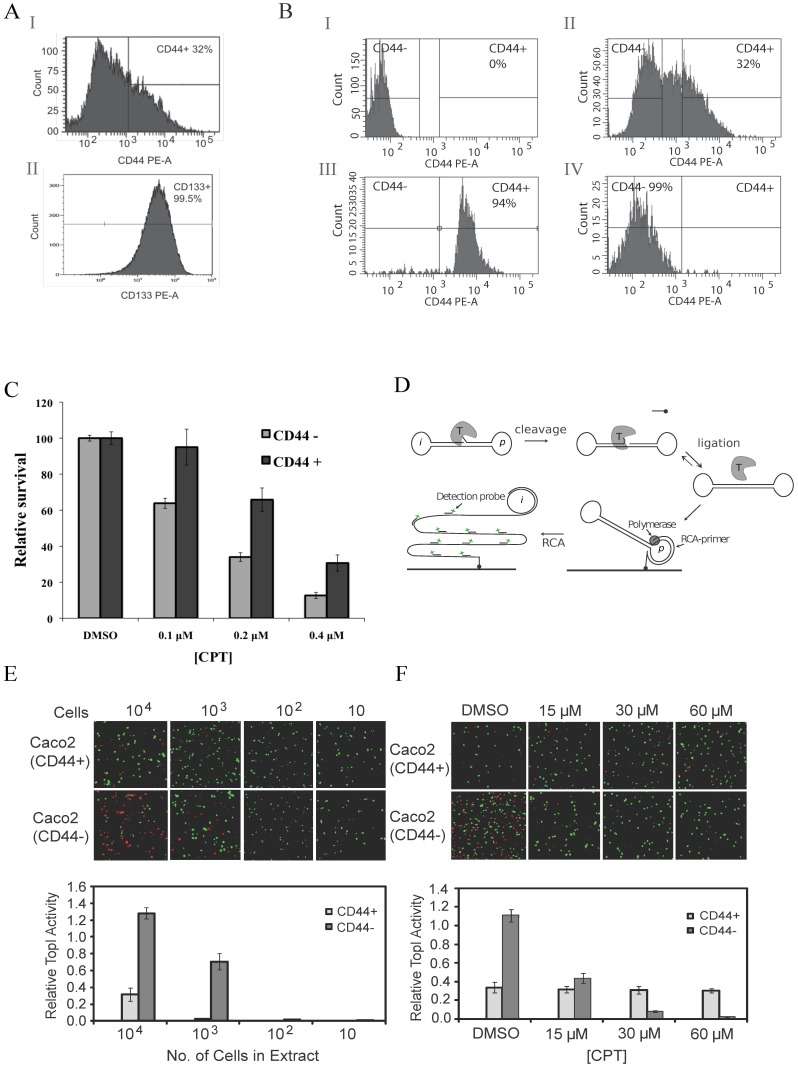
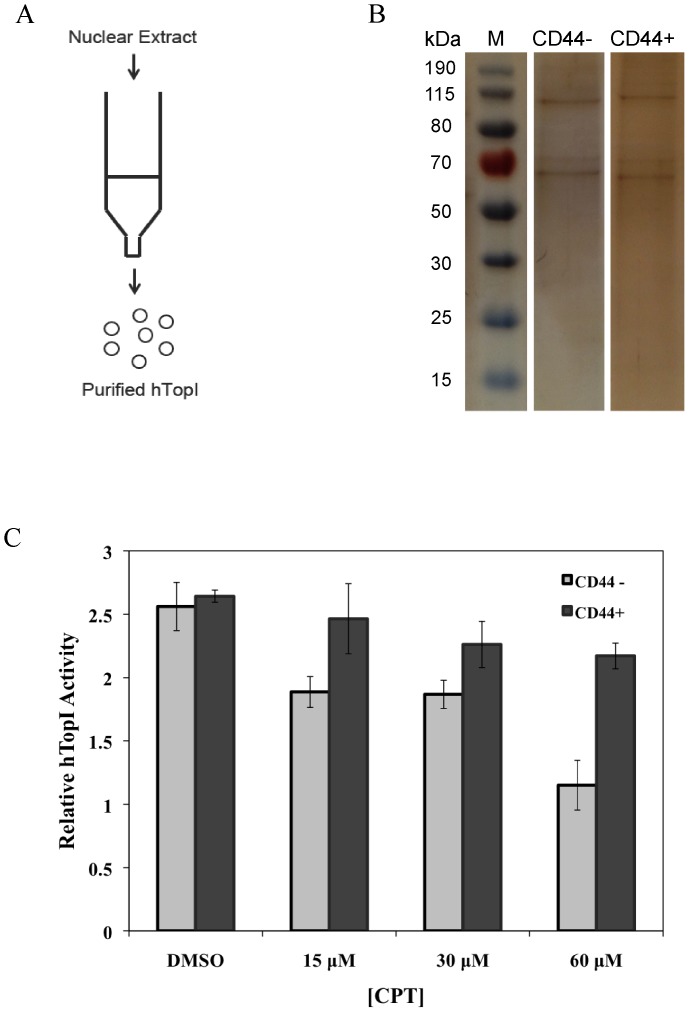
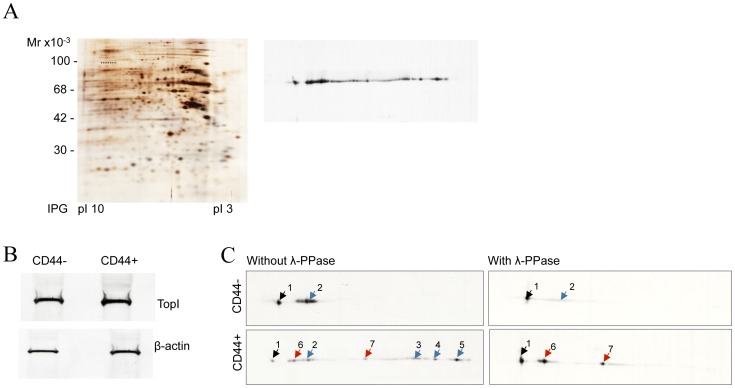
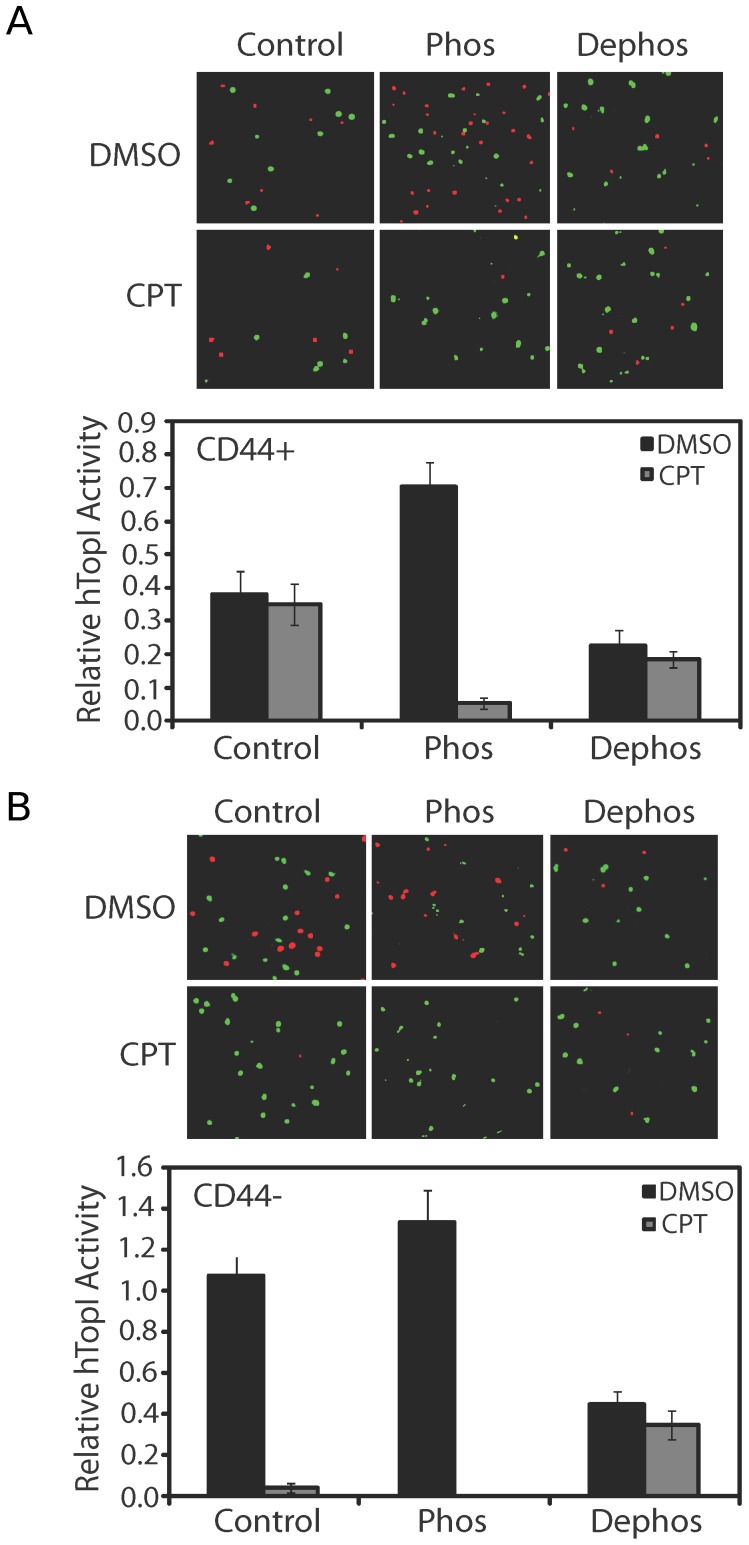
The CD44+ and CD44- subpopulations of the colorectal cancer cell line Caco2 were analyzed separately for their sensitivities to the antitumor drug camptothecin. CD44+ cells were less sensitive to camptothecin than CD44- cells. The relative resistance of CD44+ cells was correlated with (i) reduced activity of the nuclear enzyme topoisomerase I and (ii) insensitivity of this enzyme to camptothecin when analyzed in extracts. In contrast, topoisomerase I activity was higher in extracts from CD44- cells and the enzyme was camptothecin sensitive. Topoisomerase I from the two subpopulations were differentially phosphorylated in a manner that appeared to determine the drug sensitivity and activity of the enzyme. This finding was further supported by the fact that phosphorylation of topoisomerase I in CD44+ cell extract by protein kinase CK2 converted the enzyme to a camptothecin sensitive, more active form mimicking topoisomerase I in extracts from CD44- cells. Conversely, dephosphorylation of topoisomerase I in extracts from CD44- cells rendered the enzyme less active and camptothecin resistant. These findings add to our understanding of chemotherapy resistance in the Caco2 CD44+ cancer stem cell model.
Conflict of interest statement
Figures
Similar articles
-
CK2-mediated hyperphosphorylation of topoisomerase I targets serine 506, enhances topoisomerase I-DNA binding, and increases cellular camptothecin sensitivity.PLoS One. 2012;7(11):e50427. doi: 10.1371/journal.pone.0050427. Epub 2012 Nov 21. PLoS One. 2012. PMID: 23185622 Free PMC article.
-
Involvement of amino acids 361 to 364 of human topoisomerase I in camptothecin resistance and enzyme catalysis.Biochem Pharmacol. 1997 Apr 4;53(7):1019-27. doi: 10.1016/s0006-2952(96)00899-4. Biochem Pharmacol. 1997. PMID: 9174116
-
Phosphorylation of topoisomerase I in L5178Y-S cells is associated with poly(ADP-ribose) metabolism.Carcinogenesis. 1996 Mar;17(3):383-7. doi: 10.1093/carcin/17.3.383. Carcinogenesis. 1996. PMID: 8631120
-
Molecular, cellular, and clinical aspects of the pharmacology of 20(S)camptothecin and its derivatives.Pharmacol Ther. 1995;68(2):269-96. doi: 10.1016/0163-7258(95)02009-8. Pharmacol Ther. 1995. PMID: 8719971 Review.
-
Camptothecin resistance related to drug-induced down-regulation of topoisomerase I and to steps occurring after the formation of protein-linked DNA breaks.Ann N Y Acad Sci. 1996 Dec 13;803:74-92. doi: 10.1111/j.1749-6632.1996.tb26378.x. Ann N Y Acad Sci. 1996. PMID: 8993502 Review. No abstract available.
Cited by
-
Genotoxic and Anti-Migratory Effects of Camptothecin Combined with Celastrol or Resveratrol in Metastatic and Stem-like Cells of Colon Cancer.Cancers (Basel). 2024 Sep 26;16(19):3279. doi: 10.3390/cancers16193279. Cancers (Basel). 2024. PMID: 39409900 Free PMC article.
-
Optimized Detection of Plasmodium falciparum Topoisomerase I Enzyme Activity in a Complex Biological Sample by the Use of Molecular Beacons.Sensors (Basel). 2016 Nov 15;16(11):1916. doi: 10.3390/s16111916. Sensors (Basel). 2016. PMID: 27854277 Free PMC article.
-
Simple and Fast DNA Based Sensor System for Screening of Small-Molecule Compounds Targeting Eukaryotic Topoisomerase 1.Pharmaceutics. 2021 Aug 13;13(8):1255. doi: 10.3390/pharmaceutics13081255. Pharmaceutics. 2021. PMID: 34452216 Free PMC article.
-
Tyrosyl-DNA Phosphodiesterase 1 and Topoisomerase I Activities as Predictive Indicators for Glioblastoma Susceptibility to Genotoxic Agents.Cancers (Basel). 2019 Sep 23;11(10):1416. doi: 10.3390/cancers11101416. Cancers (Basel). 2019. PMID: 31547492 Free PMC article.
-
Interlinked DNA nano-circles for measuring topoisomerase II activity at the level of single decatenation events.Nucleic Acids Res. 2017 Jul 27;45(13):7855-7869. doi: 10.1093/nar/gkx480. Nucleic Acids Res. 2017. PMID: 28541438 Free PMC article.
References
-
- Ferlay J, Steliarova-Foucher E, Lortet-Tieulent J, Rosso S, Coebergh JW, et al. (2013) Cancer incidence and mortality patterns in Europe: estimates for 40 countries in 2012. European journal of cancer 49: 1374–1403. - PubMed
-
- Grivicich I, Mans DR, Peters GJ, Schwartsmann G (2001) Irinotecan and oxaliplatin: an overview of the novel chemotherapeutic options for the treatment of advanced colorectal cancer. Brazilian journal of medical and biological research = Revista brasileira de pesquisas medicas e biologicas/Sociedade Brasileira de Biofisica [et al] 34: 1087–1103. - PubMed
-
- Beretta GL, Perego P, Zunino F (2006) Mechanisms of cellular resistance to camptothecins. Current medicinal chemistry 13: 3291–3305. - PubMed
-
- Goldberg RM, Sargent DJ, Morton RF, Fuchs CS, Ramanathan RK, et al. (2004) A randomized controlled trial of fluorouracil plus leucovorin, irinotecan, and oxaliplatin combinations in patients with previously untreated metastatic colorectal cancer. Journal of clinical oncology : official journal of the American Society of Clinical Oncology 22: 23–30. - PubMed
Publication types
MeSH terms
Substances
LinkOut - more resources
Full Text Sources
Other Literature Sources
Research Materials
Miscellaneous
