. 2014 Aug;124(8):3391-406.
doi: 10.1172/JCI72517. Epub 2014 Jun 24.

Incorporation of therapeutically modified bacteria into gut microbiota inhibits obesity

Incorporation of therapeutically modified bacteria into gut microbiota inhibits obesity

Zhongyi Chen et al. J Clin Invest. 2014 Aug.

Abstract

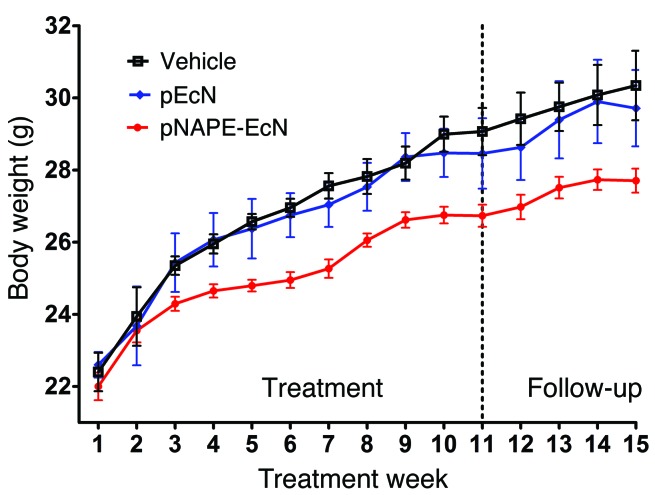
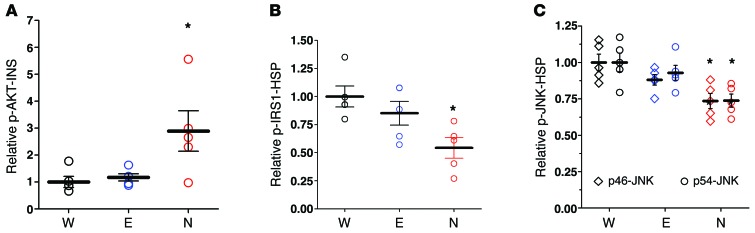
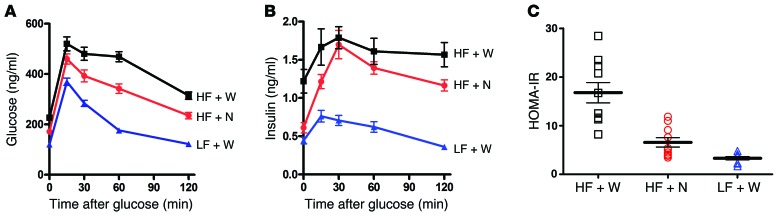
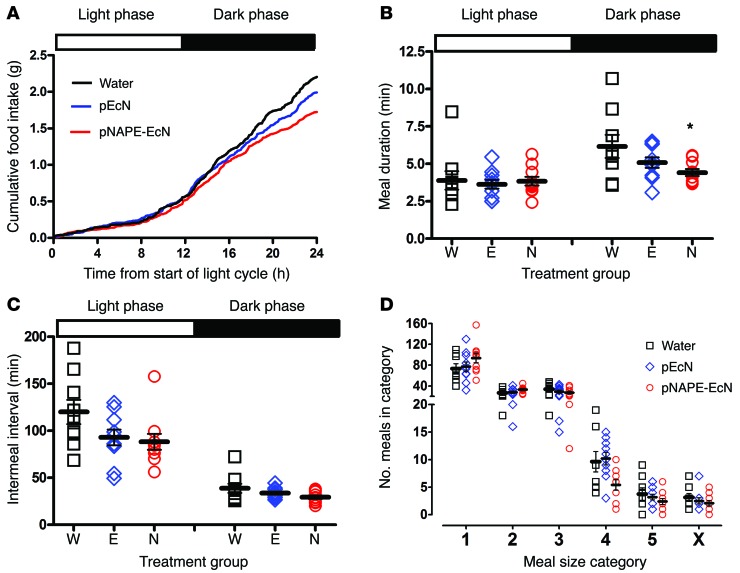
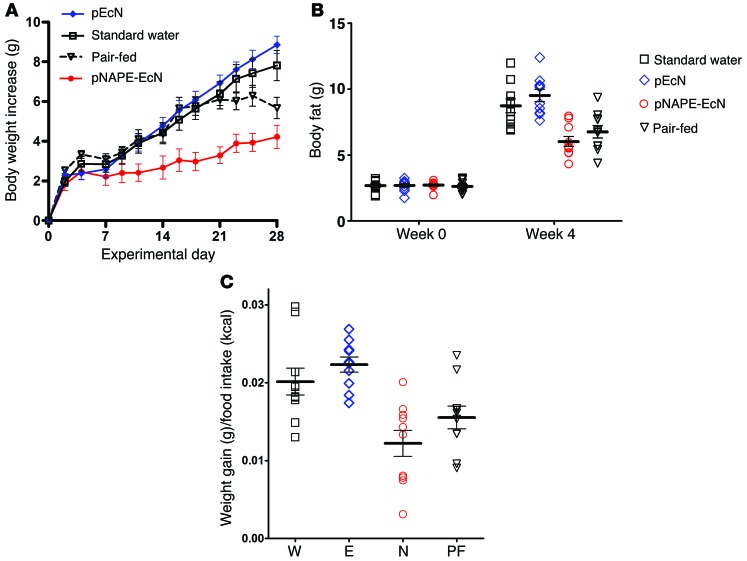
Metabolic disorders, including obesity, diabetes, and cardiovascular disease, are widespread in Westernized nations. Gut microbiota composition is a contributing factor to the susceptibility of an individual to the development of these disorders; therefore, altering a person's microbiota may ameliorate disease. One potential microbiome-altering strategy is the incorporation of modified bacteria that express therapeutic factors into the gut microbiota. For example, N-acylphosphatidylethanolamines (NAPEs) are precursors to the N-acylethanolamide (NAE) family of lipids, which are synthesized in the small intestine in response to feeding and reduce food intake and obesity. Here, we demonstrated that administration of engineered NAPE-expressing E. coli Nissle 1917 bacteria in drinking water for 8 weeks reduced the levels of obesity in mice fed a high-fat diet. Mice that received modified bacteria had dramatically lower food intake, adiposity, insulin resistance, and hepatosteatosis compared with mice receiving standard water or control bacteria. The protective effects conferred by NAPE-expressing bacteria persisted for at least 4 weeks after their removal from the drinking water. Moreover, administration of NAPE-expressing bacteria to TallyHo mice, a polygenic mouse model of obesity, inhibited weight gain. Our results demonstrate that incorporation of appropriately modified bacteria into the gut microbiota has potential as an effective strategy to inhibit the development of metabolic disorders.


Figures

Figure 13
Figure 13. Effect of pNAPE-EcN treatment on body weight of TallyHo mice fed a standard chow diet.
P < 0.0001 by 2-way ANOVA for time and P = 0.0357 for treatment. All values are the mean ± SEM; n = 5 mice per group.
Figure 12
Figure 12. Treatment with pNAPE-EcN preserves insulin sensitivity in liver by protecting against inhibitory phosphorylation of IRS1 by JNKs.
Mice treated with standard water only (W), with pEcN (E), or with pNAPE-EcN (N) for 6 weeks were fasted for 4 hours and then injected intraperitoneally with either saline (to determine response to endogenous levels of insulin; n = 5 mice per group) or 0.75 IU/kg insulin (to determine response to exogenous, pharmacological levels of insulin; n = 4–5 mice per group). 15 minutes after injection, mice were euthanized and tissue collected. Data are the mean ± SEM. (A) Extent of activating phosphorylation of Ser473 of AKT (p-AKT) in liver of saline-injected mice. Values were normalized to plasma insulin (INS) and expressed relative to the average for water-only–treated mice. P = 0.0225 by 1-way ANOVA; *P < 0.05 versus standard water by Dunnett’s multiple comparison test. (B) Extent of inhibitory Ser307 phosphorylation of IRS1. Values were normalized to heat shock protein (HSP) and expressed relative to the average for standard water-only–treated mice. P = 0.0173 by 1-way ANOVA; *P < 0.05 versus standard water by Dunnett’s multiple comparison test. (C) Extent of activating phosphorylation of JNK isoforms p46 and p54. Values were normalized to HSP and expressed relative to the average for standard water-only–treated mice. For p46-JNK, P = 0.0084 by 1-way ANOVA; *P < 0.05 versus standard water by Dunnett’s multiple comparison test. For p54-JNK, P = 0.0134 by 1-way ANOVA; *P < 0.05 versus standard water by Dunnett’s multiple comparison test. There were no significant differences between groups stimulated with the exogenous insulin.
Figure 11
Figure 11. Treatment with pNAPE-EcN reduces the insulin resistance index and increases insulin response in mice fed a high-fat diet.
All values are the mean ± SEM; n = 10 mice per group. (A) Treatment with pNAPE-EcN (HF + N) improved basal glucose levels and glucose tolerance compared with mice treated with standard drinking water (HF + W), but not a low-fat chow diet (LF + W). Fasting glucose levels differed significantly between groups (P < 0.001 by 1-way ANOVA; P < 0.05 by Bonferroni’s post-hoc multiple comparison for HF + W versus HF + N or LF + W, and HF + N versus LF + W. Glucose AUC differed significantly between each treatment group (P < 0.0009 by 1-way ANOVA); P <0.05 by Bonferroni’s post-hoc multiple comparison for HF + W (50,841 ± 2,191 mg/dl/min) versus either HF + N (39,463 ± 1,800) or LF + W (24,573 ± 517), and for HF + N versus LF + W. (B) Treatment with pNAPE-EcN increased insulin responsiveness. Fasting levels of insulin were significantly higher in HF + W versus HF + N or LF + W mice (P < 0.0001 by 1-way ANOVA); P < 0.05 by Bonferroni’s post-hoc multiple comparison for HF + W versus HF + N or LF + W, but not for HF + N versus LF + W. The insulin AUC for each treatment differed significantly: P < 0.0001 by 1-way ANOVA; P < 0.05 by Bonferroni’s post-hoc multiple comparison for LF + W (69.5 ± 5.7 ng/ml/min, mean ± SEM) versus HF + W (193.9 ± 17.0) or HF + N (158.7 ± 8.4, P < 0.05). (C) Treatment with pNAPE-EcN improved the HOMA-IR score compared with a high-fat diet–only treatment. P < 0.0001 by 1-way ANOVA; P < 0.05 by Bonferroni’s post-hoc multiple comparison for HF + W versus HF + N or LF + W, but not for HF + N versus LF + W.
Figure 10
Figure 10. Effect of pNAPE-EcN treatment on energy expenditure.
(A) Energy expenditure during 12-hour light phase of the 24-hour light-dark cycle. Slopes for each group differed: pNAPE-EcN, y = 0.01016x + 0.02295; pEcN, y = 0.006475x + 0.1201; standard water, y = 0.002726 + 0.001779; differences in slope, P = 0.04038, F = 3.702 (n = 9–10 mice per group). (B) Energy expenditure during the dark phase of the 24-hour light cycle. Slopes for each group did not differ: pNAPE-EcN, y = 0.002704 + 0.3448; pEcN, y = 0.003438+0.3304; standard water, y = 0.004455 + 0.2857; differences in slope, P = 0.8734, F = 0.1362.
Figure 9
Figure 9. Treatment with pNAPE-EcN reduces food intake and meal duration during the dark phase of the light cycle.
Mice were given standard drinking water only, water with pEcN, or water with pNAPE-EcN for 4 weeks prior to metabolic monitoring and continued to receive treated water throughout the monitoring period (n = 9–10 mice per group). (A) Average cumulative food intake during the 24-hour light cycle. For each mouse, the cumulative food intake through each 5-minute block of a 24-hour light cycle (6 am–6 am) for each of the 3 days of monitoring was averaged. The mean cumulative food intake for each treatment group is shown. The 72-hour cumulative food traces for individual mice are shown in Supplemental Figure 16. (B) Effect of treatment on meal duration in light and dark phases (mean ± SEM). P = 0.8972 by 1-way ANOVA for light phase; P = 0.0554 by 1-way ANOVA for dark phase; *P < 0.05 versus standard water by Dunnett’s multiple comparison test. (C) Effect of treatment on intermeal interval (mean ± SEM). P = 0.0743 by 1-way ANOVA for light phase; P = 0.1085 by 1-way ANOVA for dark phase. (D) Effect of treatment on meal size (mean ± SEM). Each 5-minute block during which food hopper weight decreased by greater than 0.05 mg was scored as a meal and categorized from 1 (smallest) to 5 (largest), as described in Methods. Category 4, P = 0.0256 by 1-way ANOVA; all other meal categories, P = NS by 1-way ANOVA.
Figure 8
Figure 8. Relative abundance in feces of major bacterial phylla.
Bacterial composition of feces collected during experimental week 8 (final week of treatment) and week 12 (fourth week of post-treatment follow-up) was determined by 16S rRNA sequencing (n = 9–10 mice per group). Treatment with either pNAPE-EcN (N) or pEcN (E) significantly decreased the abundance of Firmicutes compared with vehicle (V) and increased the abundance of Proteobacteria in excreted feces (week 8), but microbial composition reverted to that of the vehicle-treated animals by 4 weeks after ending bacterial administration (week 12).
Figure 7
Figure 7. Pair-feeding does not induce hepatic expression of fatty acid oxidation genes but does reduce lipid accumulation.
All values are the mean ± SEM; n = 9–10 mice per group. (A) Liver triglyceride (TG) levels in mice given standard drinking water (W), or drinking water with pEcN (E), pNAPE-EcN (N), or pEcN with pair-feeding to pNAPE-EcN mice (PF). P = 0.0012 by 1-way ANOVA; *P < 0.05 versus standard water by Dunnett’s multiple comparison test. (B) Expression of mRNA encoding for proteins related to fatty acid oxidation. Ppara, P < 0.0001 by 1-way ANOVA; *P < 0.05 versus standard water by Dunnett’s multiple comparison test; Cpt1a, P < 0.0233 by 1-way ANOVA; *P < 0.05 versus standard water by Dunnett’s multiple comparison test; AOX, P = 0.1326 by 1-way ANOVA.
Figure 6
Figure 6. Pair-feeding fails to fully recapitulate the effect of pNAPE-EcN treatment on body weight and body fat gain.
A group of mice treated with pEcN (E) were were pair-fed (PF) by restricting them to the same number of calories of food as the pNAPE-EcN mice (N). An ad libitum–fed control group received standard drinking water (W). All values are the mean ± SEM; n = 9–10 mice per group. (A) Body weight gain during 4 weeks of treatment and pair-feeding. Two-way RM ANOVA, P < 0.0001 for time, P = 0.0003 for treatment. P < 0.05 by Bonferroni’s multiple comparison test for pair-fed versus pNAPE-EcN for days 16 to 25. P < 0.05 for pair-fed versus pEcN and versus standard water for day 28. (B) Body fat at week 0 (before beginning treatment) and week 4 (28 days after beginning treatment). No group differences were observed at week 0. Week 4 1-way ANOVA, P < 0.0001 by 1-way ANOVA; P < 0.05 by Dunnett’s multiple comparison test for pair-fed versus water or versus pEcN. Pair-fed versus pNAPE-EcN, not significant. (C) Calculated feeding efficiency, P < 0.0001 by 1-way ANOVA; P < 0.05 BY Dunnett’s multiple comparison test for pair-fed versus pEcN; pair-fed versus standard water or versus pNAPE-EcN, not significant.
Figure 5
Figure 5. Treatment with pNAPE-EcN reduces infiltration of F4/80 and CD11b immunopositive leukocytes into liver.
Slides were immunostained with either anti-F4/80 (AD) or anti-CD11b (EH) antibodies (DAB brown stain) and counterstained with hematoxylin. Representative photomicrographs are shown. Scale bars: 10 μm. (A and E) Standard drinking water only. (B and F) Vehicle-treated (0.125% gelatin) mice. (C and G) pEcN-treated mice. (D and H) pNAPE-EcN–treated mice.
Figure 4
Figure 4. Treatment with pNAPE-EcN induces expression of genes encoding for fatty acid oxidation, but not fatty acid synthesis, and reduces expression of inflammatory genes in the liver.
Liver mRNA was measured by qRT-PCR using primers specific for each gene. β-actin (Actb) was used as a control, and all values were normalized to the vehicle group (mean ± SEM, n = 10 mice per group). *P < 0.05 by 1-way ANOVA for individual gene expression and by Dunnett’s multiple comparison test versus vehicle for pNAPE-EcN, but not for pEcN.
Figure 3
Figure 3. Treatment with pNAPE-EcN increases hepatic NAE levels.
NAEs were measured by LC/MS in liver collected from mice 2 days after ending a 9-week treatment with pNAPE-EcN or from untreated mice receiving standard drinking water (Water) during this same period (n = 10 mice per group; mean ± SEM). NAE levels were significantly different (2-way ANOVA, for treatment P < 0.0001, for NAE species P < 0.0001). Summed NAE levels were 1.70 ± 0.18 versus 2.45 ± 0.21 nmol/g liver for untreated versus pNAPE-EcN–treated mice, respectively.
Figure 2
Figure 2. Effects of pNAPE-EcN persist for more than 6 weeks after ending administration.
Groups of mice were fed a high-fat diet for a total of 20 weeks (n = 10 mice per group). For the first 8 weeks, mice were administered either vehicle (0.125% gelatin), 5 × 10⁹ CFU pEcN/ml, or 5 × 10⁹ CFU pNAPE-EcN/ml. For the remaining 12 weeks, all mice received standard drinking water. (A) Effect of treatment on total body weight. (B) Body weight of group treated with pNAPE-EcN normalized to the vehicle-treated group. (C) Percentage of body fat for all 3 groups. (D) Percentage of body fat of pNAPE-EcN mice normalized to the vehicle-treated mice. (E) Daily average food intake for each group as a 2-week rolling average. A rolling average was used to minimize day-to-day variations to better determine the overall trends. The dip in food intake that occurred in all groups after day 70 is likely the result of changing the housing location of all the mice due to institutional requirements. (F) Daily average food intake of pNAPE-EcN–treated mice normalized to the vehicle-treated mice.
Figure 1
Figure 1. Treatment with pNAPE-EcN, but not pEcN, inhibits gain in body weight and adiposity.
All values are the mean ± SEM (n = 10 mice per group). Solid bars indicate time points with significant differences between pNAPE-EcN and other groups (P < 0.05 by Bonferroni’s multiple comparison test). (A) Effect of treatments on gain in body weight from start of treatment (2-way RM ANOVA, for treatment P = 0.0073, for time P < 0.0001). (B) Effect of treatments on fat mass (2-way RM ANOVA, for treatment P = 0.0127, for time P < 0.0001). (C) Effect of treatments on lean body mass (2-way RM ANOVA, for treatment P = 0.8113, for time P < 0.001). (D) Effect of treatments on cumulative food intake from start of treatment (2-way RM ANOVA, for treatment P = 0.0035, for time P < 0.0001).

References

    1. Lam DW, LeRoith D. The worldwide diabetes epidemic. Curr Opin Endocrinol Diabetes Obes. 2012;19(2):93–96. doi: 10.1097/MED.0b013e328350583a. - DOI - PubMed
    1. Flegal KM, Carroll MD, Ogden CL, Curtin LR. PRevalence and trends in obesity among us adults, 1999–2008. JAMA. 2010;303(3):235–241. doi: 10.1001/jama.2009.2014. - DOI - PubMed
    1. Wing RR, Hill JO. Successful weight loss maintenance. Annu Rev Nutr. 2001;21:323–341. doi: 10.1146/annurev.nutr.21.1.323. - DOI - PubMed
    1. Stunkard A, Mc L-HM. The results of treatment for obesity: a review of the literature and report of a series. AMA Arch Intern Med. 1959;103(1):79–85. doi: 10.1001/archinte.1959.00270010085011. - DOI - PubMed
    1. Kramer FM, Jeffery RW, Forster JL, Snell MK. Long-term follow-up of behavioral treatment for obesity: patterns of weight regain among men and women. Int J Obes. 1989;13(2):123–136. - PubMed

Publication types

MeSH terms