. 2014 Jun 24;9(6):e100777.
doi: 10.1371/journal.pone.0100777. eCollection 2014.

Long-term treatment with the sodium glucose cotransporter 2 inhibitor, dapagliflozin, ameliorates glucose homeostasis and diabetic nephropathy in db/db mice

Affiliations

Long-term treatment with the sodium glucose cotransporter 2 inhibitor, dapagliflozin, ameliorates glucose homeostasis and diabetic nephropathy in db/db mice

Naoto Terami et al. PLoS One. .

Abstract

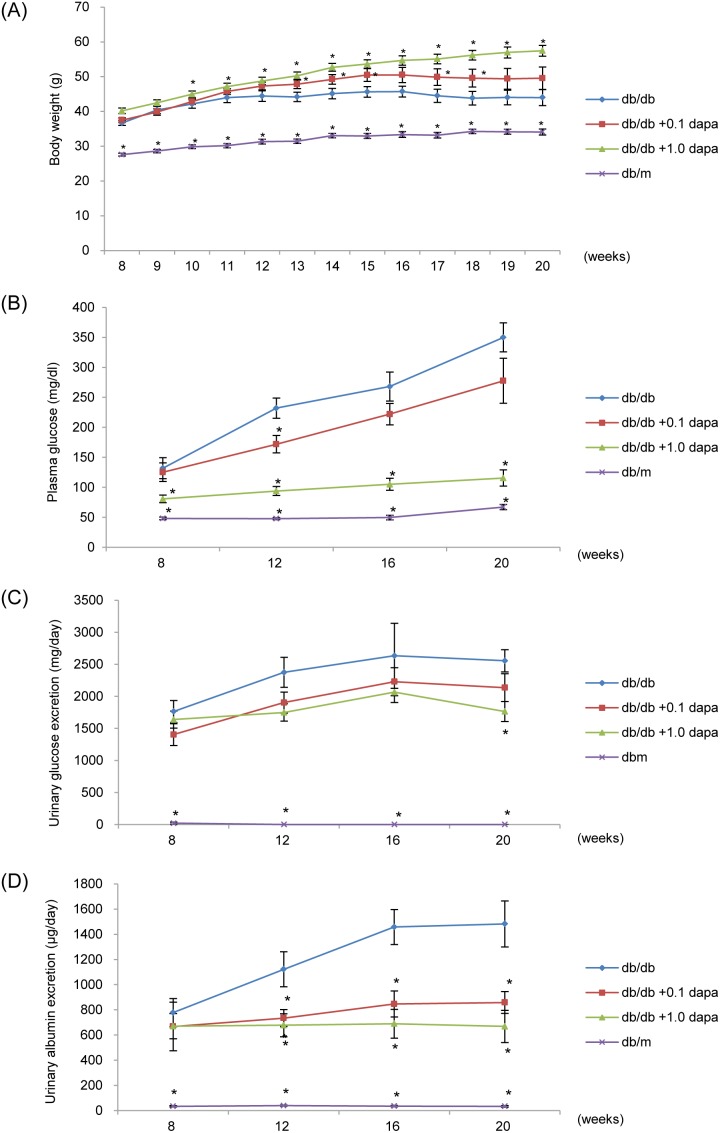
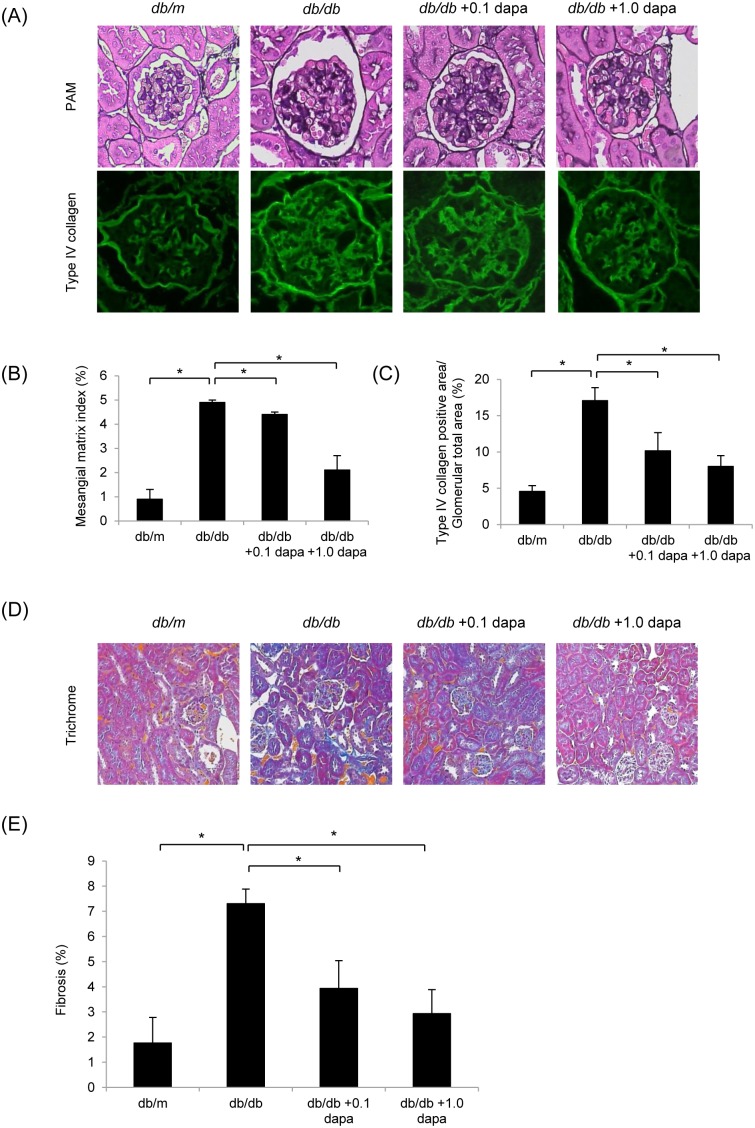
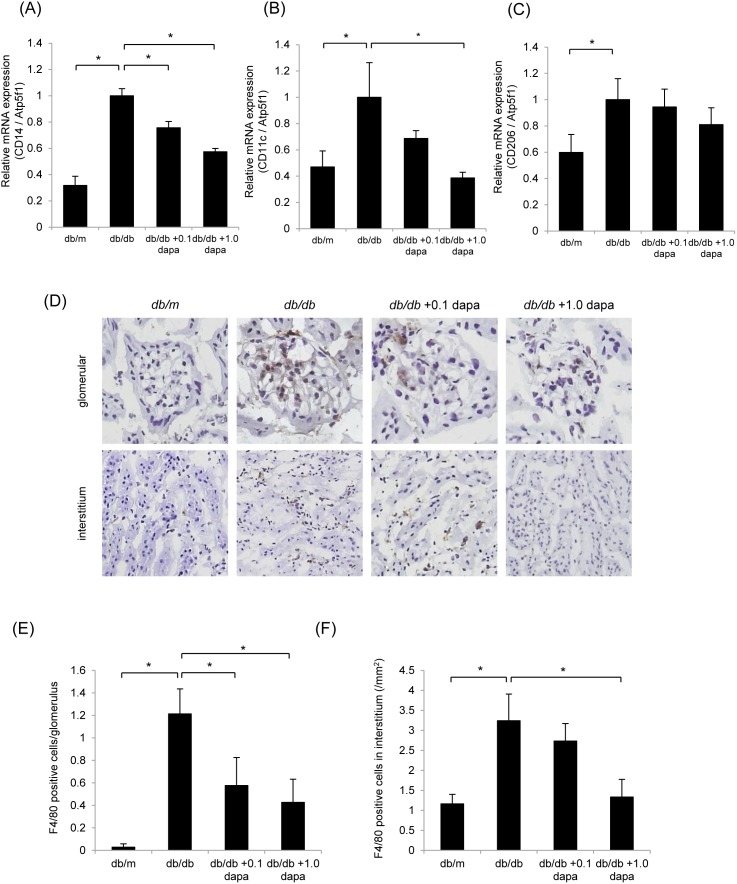
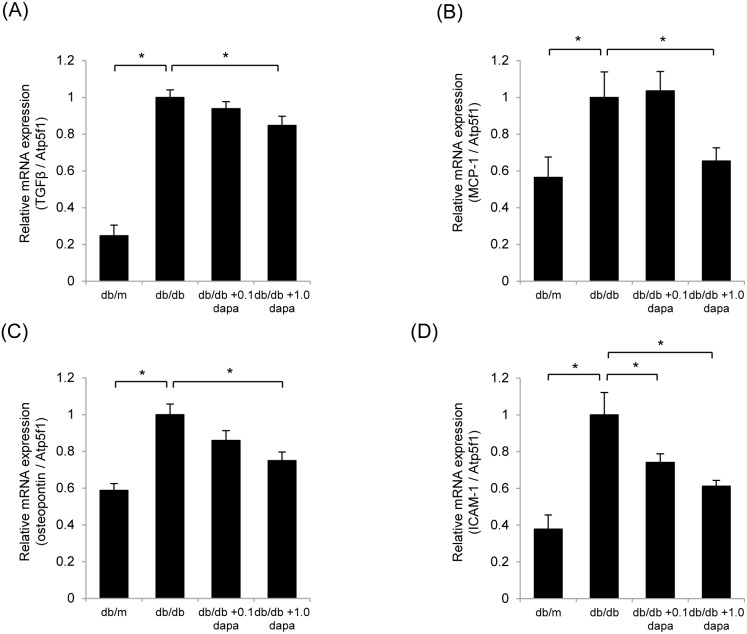
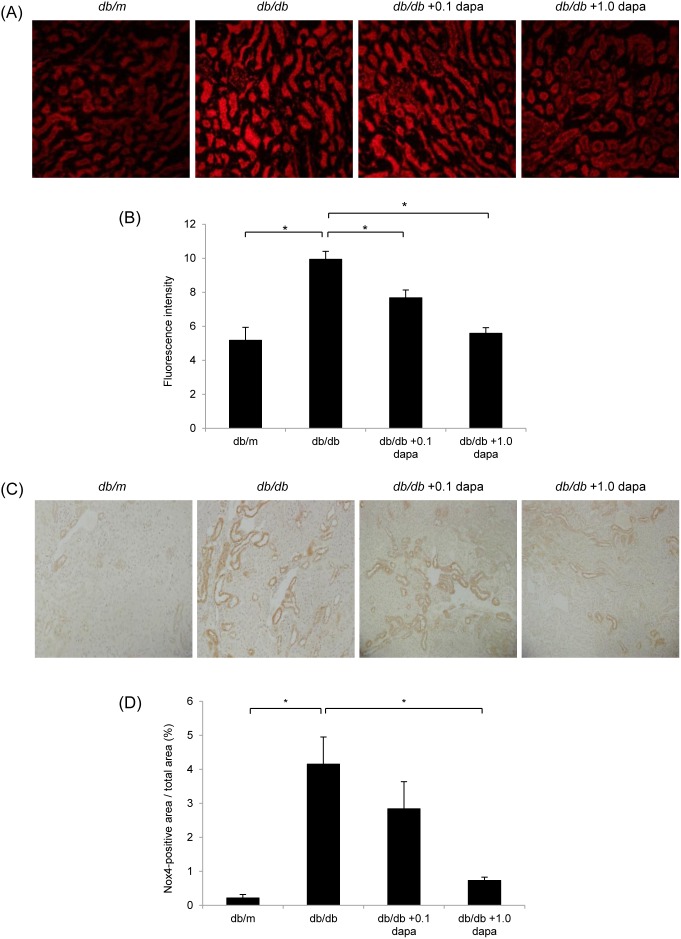
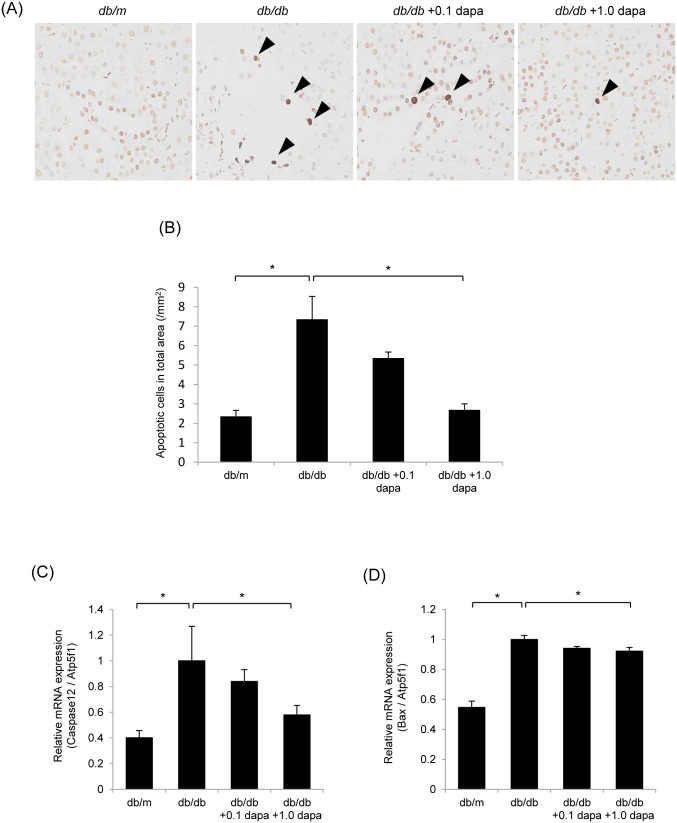
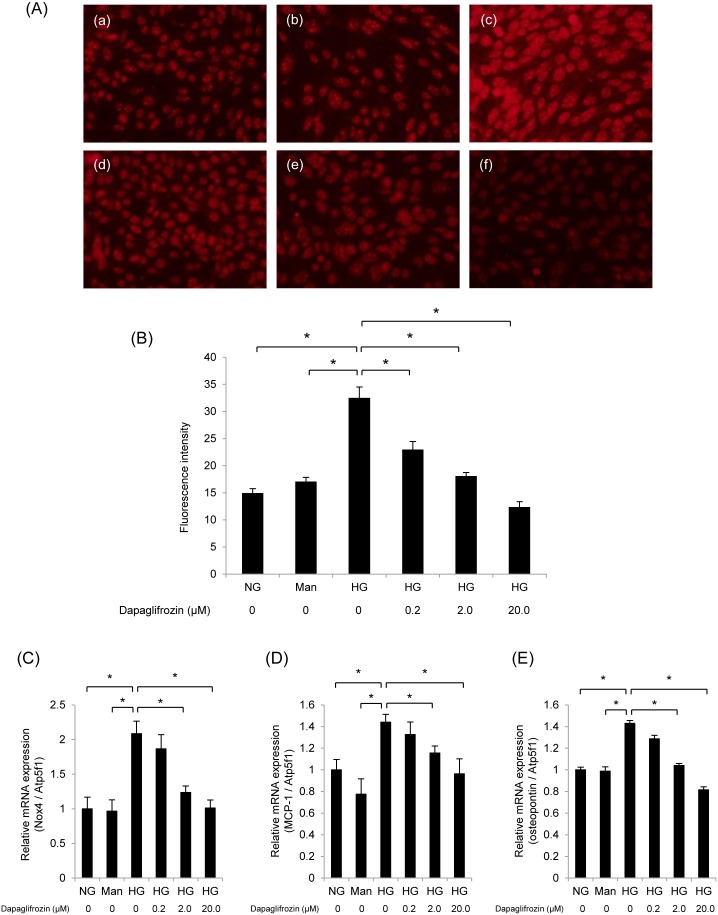
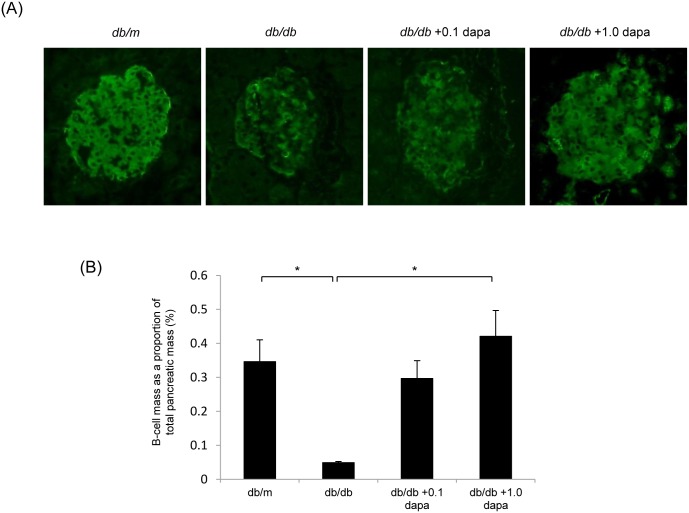
Inhibition of sodium glucose cotransporter 2 (SGLT2) has been reported as a new therapeutic strategy for treating diabetes. However, the effect of SGLT2 inhibitors on the kidney is unknown. In addition, whether SGLT2 inhibitors have an anti-inflammatory or antioxidative stress effect is still unclear. In this study, to resolve these issues, we evaluated the effects of the SGLT2 inhibitor, dapagliflozin, using a mouse model of type 2 diabetes and cultured proximal tubular epithelial (mProx24) cells. Male db/db mice were administered 0.1 or 1.0 mg/kg of dapagliflozin for 12 weeks. Body weight, blood pressure, blood glucose, hemoglobin A1c, albuminuria and creatinine clearance were measured. Mesangial matrix accumulation and interstitial fibrosis in the kidney and pancreatic β-cell mass were evaluated by histological analysis. Furthermore, gene expression of inflammatory mediators, such as osteopontin, monocyte chemoattractant protein-1 and transforming growth factor-β, was evaluated by quantitative reverse transcriptase-PCR. In addition, oxidative stress was evaluated by dihydroethidium and NADPH oxidase 4 staining. Administration of 0.1 or 1.0 mg/kg of dapagliflozin ameliorated hyperglycemia, β-cell damage and albuminuria in db/db mice. Serum creatinine, creatinine clearance and blood pressure were not affected by administration of dapagliflozin, but glomerular mesangial expansion and interstitial fibrosis were suppressed in a dose-dependent manner. Dapagliflozin treatment markedly decreased macrophage infiltration and the gene expression of inflammation and oxidative stress in the kidney of db/db mice. Moreover, dapagliflozin suppressed the high-glucose-induced gene expression of inflammatory cytokines and oxidative stress in cultured mProx24 cells. These data suggest that dapagliflozin ameliorates diabetic nephropathy by improving hyperglycemia along with inhibiting inflammation and oxidative stress.


Conflict of interest statement

Competing Interests: D. Ogawa belongs to the Department of Diabetic Nephropathy, which is endowed by Boehringer Ingelheim. J. Wada is a consultant for Boehringer Ingelheim and receives speaker honoraria from Novartis. H. Makino is a consultant for AbbVie, Astellas and Teijin, receives speaker honoraria from Astellas, Boehringer-ingelheim, Chugai, Daiichi Sankyo, Dainippon Sumitomo, Kyowa Hakko Kirin, MSD, Novartis, Pfizer, Takeda, and Tanabe Mitsubishi, and receives grant support from Astellas, Boehringer-ingelheim, Daiichi Sankyo, Dainippon Sumitomo, Kyowa Hakko Kirin, Mochida, MSD, Novartis, Novo Nordisk, Pfizer, Takeda, and Tanabe Mitsubishi. There are no patents, products in development or marketed products to declare. This does not alter the authors’ adherence to all the PLOS ONE policies on sharing data and materials.

Figures

Figure 1
Figure 1. Effect of dapagliflozin on body weight, hyperglycemia and urinary albumin excretion (UAE).
(A) Body weight was higher in the db/db group than in the db/m group during the study. Body weight in the db/db with 1.0 mg/kg dapagliflozin group (db/db+0.1 dapa group) was higher than in the db/db group from 10 to 20 weeks of age. Data are mean ± SEM. *P<0.05. (B–D) Plasma and urinary glucose, and UAE progressively increased in the db/db group during the 12-week observation period. These parameters were significantly lower in the db/db+1.0 dapa group than in the db/db group. Data are mean ± SEM. *P<0.05.
Figure 2
Figure 2. Dapagliflozin suppresses mesangial matrix accumulation and interstitial fibrosis.
(A) Periodic acid-methenamine silver (PAM) and type IV collagen staining of kidney sections. Mesangial matrix accumulation was prominent in the db/db group. Dapagliflozin suppressed the increase in mesangial matrix accumulation compared with that in the db/db group. Original magnification, ×400. (B) Mesangial matrix index of the glomeruli. Data are mean ± SEM. *P<0.05. (C) Type IV collagen positive area in the glomeruli. Data are mean ± SEM. *P<0.05. (D) Masson’s trichrome staining of kidney sections. Interstitial fibrosis was significantly higher in the db/db group than in the db/m group, and significantly lower in the db/db+1.0 dapa group than in the db/db group. Original magnification, ×100. (E) Percentages of fibrosis in interstitia. Data are mean ± SEM. *P<0.05.
Figure 3
Figure 3. Dapagliflozin inhibits proinflammatory macrophage infiltration in the renal cortex.
Quantitative RT-PCR analysis of the expression of CD14 (A), CD11c (B) and CD206 (C) showed that dapagliflozin suppressed gene expression in proinflammatory macrophages in the kidney. mRNA levels were normalized against Atp5f1 expression. Data are mean ± SEM. *P<0.05. (D) Macrophage infiltration into the glomeruli and the interstitium was clearly evident in the db/db group compared with that in the db/m group, and was suppressed in the db/db+dapa groups compared with that in the db/db group. Original magnifications: ×400 for glomeruli and ×100 for interstitia. (E) Number of macrophages in the glomerulus. Data are mean ± SEM. *P<0.05. (F) Number of macrophages in the interstitia. Data are mean ± SEM. *P<0.05.
Figure 4
Figure 4. Dapagliflozin suppresses inflammatory gene expression in the renal cortex.
Quantitative RT-PCR analysis of the expression of TGF-β (A), MCP-1 (B), osteopontin (C) and ICAM-1 (D) showed that dapagliflozin inhibited diabetes-induced inflammation in the kidney. mRNA levels were normalized against Atp5f1 expression. Data are mean ± SEM. *P<0.05.
Figure 5
Figure 5. Dapagliflozin inhibits oxidative stress in the kidney.
(A, B) ROS production was detected by fluorescence microscopy using dihydroethidium (DHE) staining. ROS was predominantly localized in the interstitia of db/db mice, and was suppressed in the db/db+dapa groups compared with that in the db/db group. Original magnification, ×100. Data are mean ± SEM. *P<0.05. (C, D) Localization of Nox4 was detected by immunohistochemistry. The expression of Nox4 was predominantly localized in the interstitia of db/db mice, and was suppressed in the db/db+dapa groups compared with that in in the db/db group. Original magnification, ×100. Data are mean ± SEM. *P<0.05.
Figure 6
Figure 6. Dapagliflozin inhibits apoptosis in the kidney.
(A, B) Apoptosis was detected by TUNEL staining. Arrowheads indicate the apoptotic nuclei. The number of apoptotic cells was higher in the interstitia of db/db mice than in db/m mice, and was lower in the db/db+dapa groups than in the db/db group. Original magnification, ×400. Data are mean ± SEM. *P<0.05. (C, D) Dapagliflozin reduced the mRNA levels of Caspase-12 and Bax in the kidney. mRNA levels were normalized against Atp5f1 expression. Data are mean ± SEM. *P<0.05.
Figure 7
Figure 7. Dapagliflozin suppresses oxidative stress and inflammatory gene expression in cultured proximal tubular epithelial cells.
(A) ROS production was detected by fluorescence microscopy using dihydroethidium (DHE) staining. ROS production was not increased by mannitol (b) compared with normal glucose (a), but was increased by high glucose (c). High-glucose-induced ROS production was decreased by dapagliflozin pretreatment in a dose-dependent manner (d: 0.2 nM; e: 2.0 nM; f: 20.0 nM). (B) Densitometric quantification of ROS production. Data are mean ± SEM. *P<0.05 vs. high glucose; NG: normal glucose; Man: mannitol; HG: high glucose; dapa: dapagliflozin. Quantitative RT-PCR analysis of the expression of Nox4 (C), MCP-1 (D) and osteopontin (E) showed that dapagliflozin inhibited diabetes-induced inflammation in the kidney. mRNA levels were normalized against Atp5f1 expression. Data are mean ± SEM. *P<0.05.
Figure 8
Figure 8. Treatment with dapagliflozin increases β-cell mass in db/db mice.
(A) Representative immunofluorescent staining of insulin in pancreatic sections derived from db/m, db/db, and db/db with 0.1 or 1.0 mg/kg dapagliflozin mice. Original magnification, ×400. (B) The β-cell area is shown as a proportion of the area of the entire pancreas. Data are mean ± SEM. *P<0.05.

References

    1. Gilbertson DT, Liu J, Xue JL, Louis TA, Solid CA, et al. (2005) Projecting the number of patients with end-stage renal disease in the United States to the year 2015. J Am Soc Nephrol 16: 3736–3741. - PubMed
    1. Kanwar YS, Sun L, Xie P, Liu FY, Chen S (2011) A glimpse of various pathogenetic mechanisms of diabetic nephropathy. Annu Rev Pathol 6: 395–423. - PMC - PubMed
    1. Navarro-Gonzalez JF, Mora-Fernandez C, Muros de Fuentes M, Garcia-Perez J (2011) Inflammatory molecules and pathways in the pathogenesis of diabetic nephropathy. Nat Rev Nephrol 7: 327–340. - PubMed
    1. Giacco F, Brownlee M (2010) Oxidative stress and diabetic complications. Circ Res 107: 1058–1070. - PMC - PubMed
    1. Hediger MA, Rhoads DB (1994) Molecular physiology of sodium-glucose cotransporters. Physiol Rev 74: 993–1026. - PubMed

Publication types

MeSH terms