. 2014 Jun 24:2:4172.
doi: 10.1038/ncomms5172.

Chronic inflammation induces telomere dysfunction and accelerates ageing in mice

Affiliations
Free PMC article

Chronic inflammation induces telomere dysfunction and accelerates ageing in mice

Diana Jurk et al. Nat Commun. .
Free PMC article

Abstract

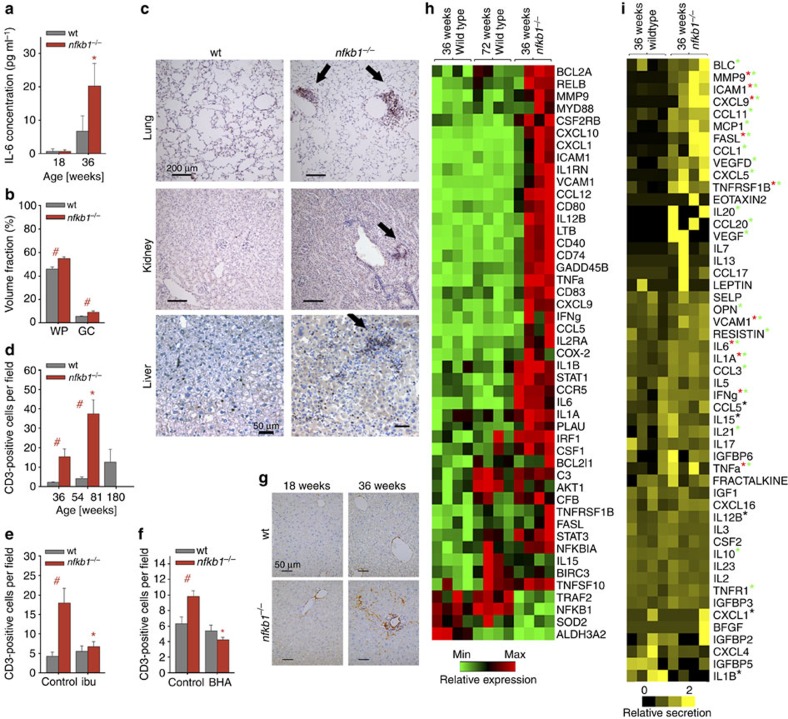
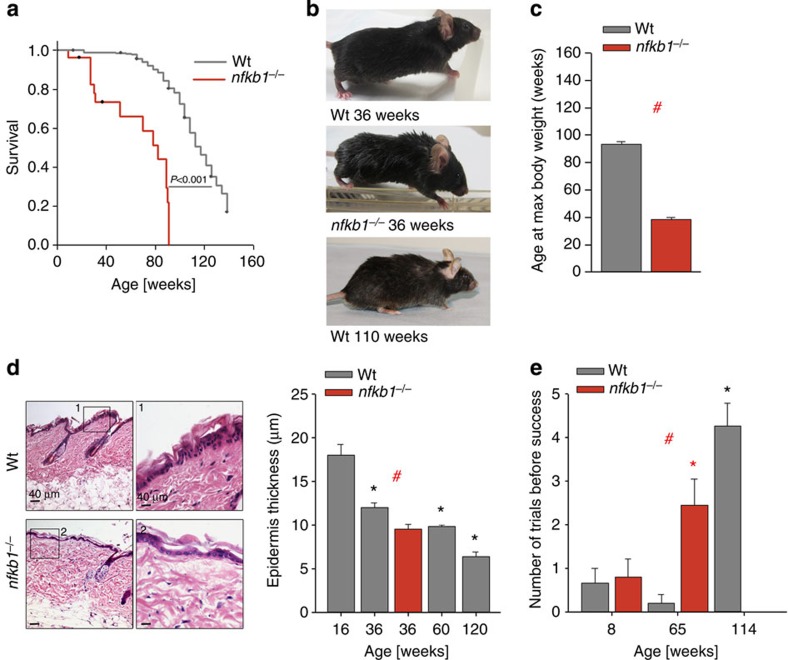
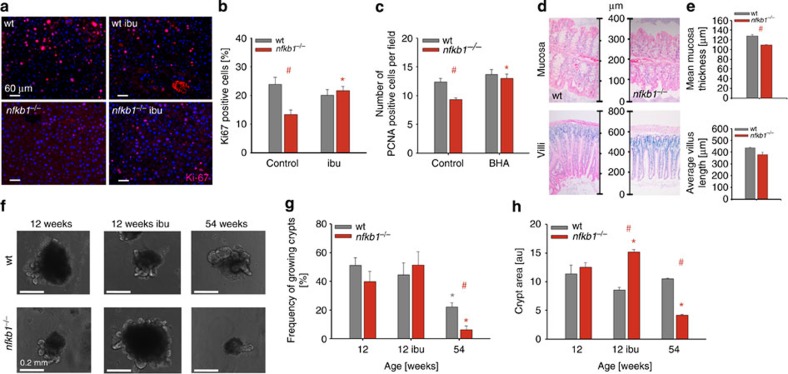
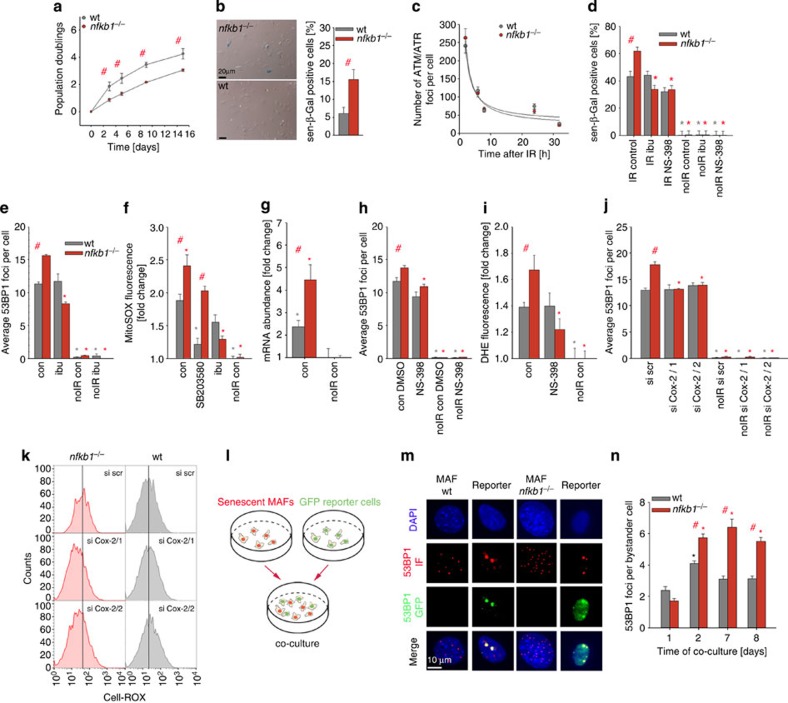
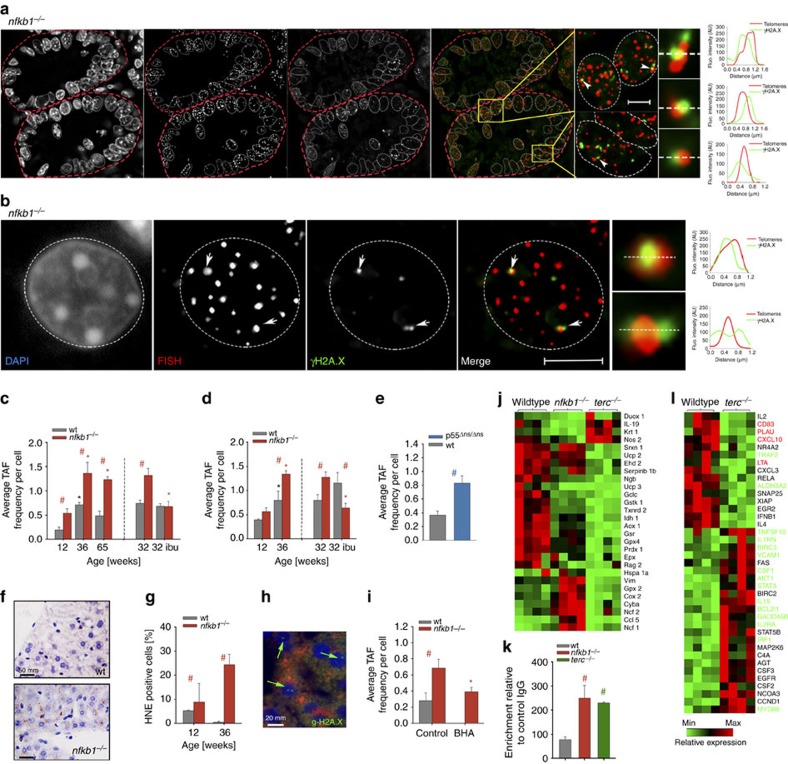
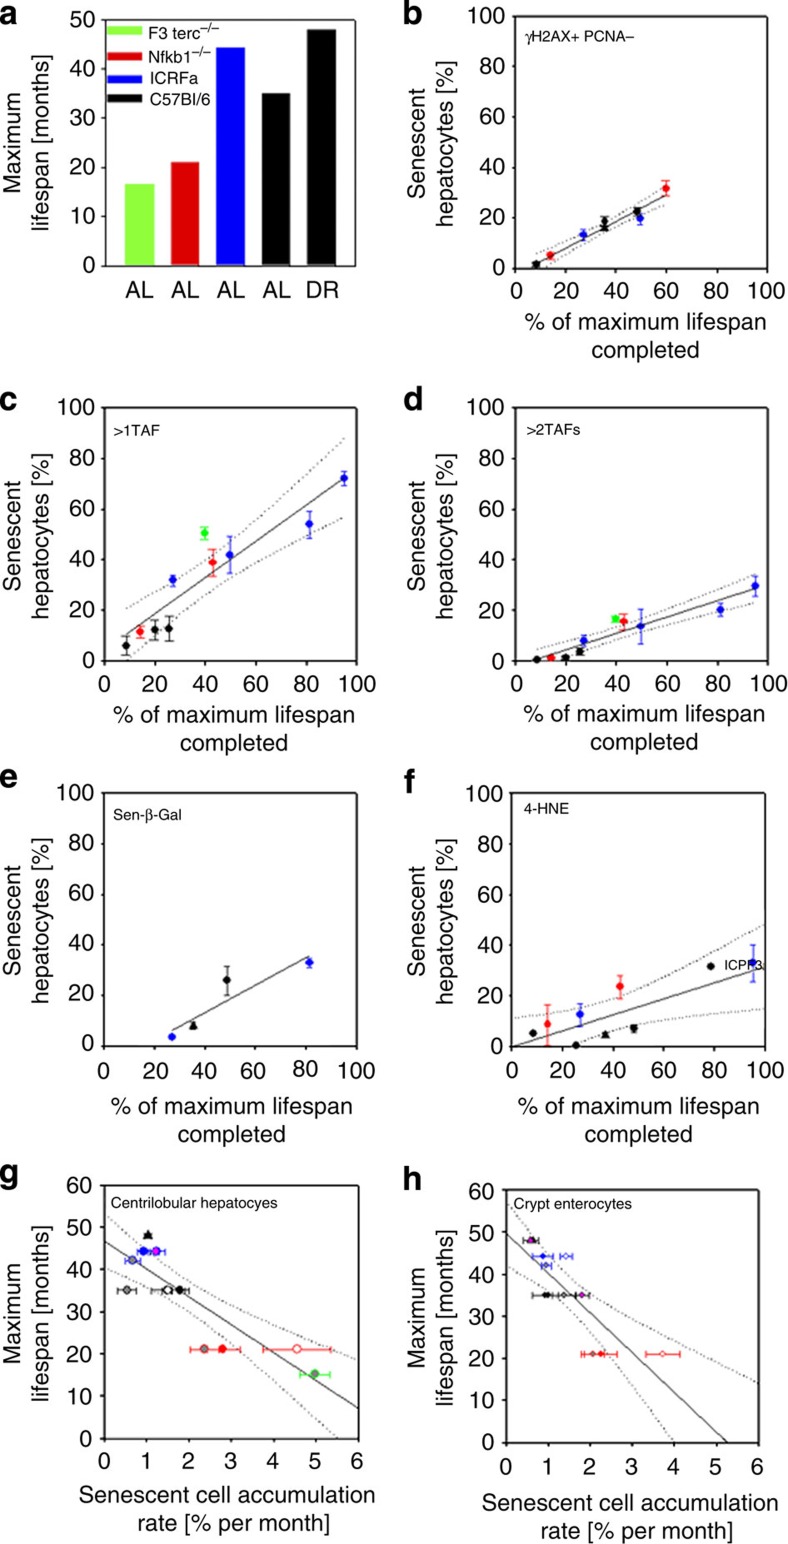
Chronic inflammation is associated with normal and pathological ageing. Here we show that chronic, progressive low-grade inflammation induced by knockout of the nfkb1 subunit of the transcription factor NF-κB induces premature ageing in mice. We also show that these mice have reduced regeneration in liver and gut. nfkb1(-/-) fibroblasts exhibit aggravated cell senescence because of an enhanced autocrine and paracrine feedback through NF-κB, COX-2 and ROS, which stabilizes DNA damage. Preferential accumulation of telomere-dysfunctional senescent cells in nfkb1(-/-) tissues is blocked by anti-inflammatory or antioxidant treatment of mice, and this rescues tissue regenerative potential. Frequencies of senescent cells in liver and intestinal crypts quantitatively predict mean and maximum lifespan in both short- and long-lived mice cohorts. These data indicate that systemic chronic inflammation can accelerate ageing via ROS-mediated exacerbation of telomere dysfunction and cell senescence in the absence of any other genetic or environmental factor.


Figures

Figure 1
Figure 1. Loss of nfkb1 induces an inflammatory phenotype in mice.
All data are mean (M) ±s.e.m., 5–6 animals per group, if not otherwise indicated. Significant differences (ANOVA, P<0.05) to young animals are indicated by *, and between wt and nfkb1−/− strains at the same age group by #. (a) IL-6 levels in blood plasma as measured by ELISA at the indicated ages. (b) White pulp (WP) and germinal center (GC) volume densities measured on spleen H&E images at 36 weeks of age. (c) Representative CD3 immunohistochemistry at 36 weeks of age showing increased immune cell infiltrations (arrows) in lung (top), kidney (middle) and liver (bottom) of nfkb1−/−, but not wt, mice. (d) Frequencies of CD3-positive cells in livers at the indicated ages. (e) Frequencies of CD3-positive cells in livers at 32 weeks of age following treatment of mice with ibuprofen or vehicle for 8 weeks. (f) Frequencies of CD3-positive cells in livers at 12 weeks of age following treatment of mice with the antioxidant BHA or vehicle for 4 weeks. (g) Representative α smooth muscle cell actin (α-SMA) immunohistochemistry showing increased pro-fibrotic activity in livers from nfkb1−/− mice. (h) Expression of NF-κB target genes in liver (qPCR array) at the indicated ages, n=4 per group. All genes that are significantly changed (P<0.05) in at least one group are shown. (i) Cytokine expression pattern in liver at 36 weeks of age, n=4 per group. Green star indicates proteins upregulated in nfkb1−/− (P<0.10, t-test), red star indicates that mRNA upregulation (h) was confirmed at protein level, black star indicates that mRNA upregulation was not confirmed at protein level.
Figure 2
Figure 2. Premature ageing of nfkb1−/− mice.
(a) Kaplan–Meier survival curves (right censored) of wt and nfkb1−/− mice, log-rank test, n≥27. (b) Representative images of wt mice and an nfkb1−/− mouse at the indicated ages showing premature hair greying and scruffy fur in nfkb1−/− mice. (c) Age at maximum body weight in nfkb1−/− and wt mice (n=56 for wt, n=8 for nfkb1−/−, P<0.05, t-test). (d) Representative skin sections of 36-week-old animals, H&E stain. Boxed areas are shown at higher magnification. Mean epidermal thickness at the indicated ages is shown on the right (n≥5). (e) Neuromuscular coordination measured as number of unsuccessful attempts to remain on a straight rod for 60 s (n=6 to 10 per group). All data are M±s.e.m. Significant differences (ANOVA with post hoc Holm–Sidak test, P<0.05) to respective controls of the same genotype are indicated by *, and between wt and nfkb1−/− strains at the same treatment by #.
Figure 3
Figure 3. Impaired regeneration in gut and liver of nfkb1−/− mice is ameliorated by treatment with NSAID.
Significant differences (ANOVA with post hoc Holm–Sidak test, P<0.05) to respective controls of the same genotype are indicated by *, and between wt and nfkb1−/− strains at the same treatment by #. (a) Representative Ki-67 immunofluorescence (red) images from wt (top) and nfkb1−/− (bottom) livers at 72 h after partial hepatectomy at 12 weeks of age. Mice were pretreated with or without ibuprofen for 4 weeks. (b) Frequencies of Ki-67-positive hepatocytes at 72 h after partial hepatectomy in wt and nfkb1−/− animals. Data are M±s.e.m. from seven animals per group. (c) Frequencies of PCNA-positive hepatocytes at 72 h after partial hepatectomy in wt and nfkb1−/− animals, pretreated or not with the antioxidant BHA for 4 weeks. Data are M±s.e.m. from 7 animals per group. (d) Representative colonic (top) and intestinal (bottom) H&E sections from wt and nfkb1−/− mice aged 36 weeks. (e) Quantification of colonic mucosal thickness (top) and villus length (bottom). Data are M±s.e.m. from 30–100 colonic crypts from 4 animals, P=0.0001, and from 20–60 villi from 3–5 animals, P=0.029. (f) Representative images of single crypts isolated from mice at the indicated age and grown for 10 days in vitro. (g) Frequencies of crypts that grew in vitro. (h) Crypt size (surface area) at day 10 in vitro. Data in (g) and (h) are M±s.e.m. from 20–200 crypts isolated from three animals per group.
Figure 4
Figure 4. nfkb1−/− aggravates the senescent phenotype in MAFs.
All data are M±s.e.m. from 3or 4 independent strains per condition, if not otherwise indicated. Significant differences (ANOVA with post-hoc Holm-Sidak test, P<0.05) to respective controls are indicated by *, and between wt and nfkb1−/− strains at the same treatment/time point by #. (a) Growth of nfkb1−/− and wt MAFs in culture under 21% ambient oxygen. (b) Frequencies of sen-β-Gal-positive MAFs after 10 days under 21% ambient oxygen. (c) ATM/ATR foci frequencies in wt and nfkb1−/− MAF nuclei at the indicated times after 10 Gy IR. (d) Frequencies of sen-β-Gal-positive MAFs at 3 days after induction of senescence by 10 Gy IR and treatment (or not) with the NSAID ibuprofen (ibu, 0.2 mM) or the COX-2 inhibitor NS-398 (2.5 mM). (e) Frequencies of nuclear 53BP1 foci in MAFs at 3 days after 10 Gy IR and treatment (or not) with ibuprofen. (f) Mitochondrial superoxide levels measured by MitoSOX fluorescence in MAFs at day 3 after treatment with/without 10 Gy IR and the p38 inhibitor SB203580 (10 μM) or ibuprofen (0.2 mM). (g) Expression of the COX-2 gene (normalized to actin) in MAFs 3 days after treatment with/without 10 Gy IR. (h) 53BP1 foci frequencies in MAFs treated with the COX-2 inhibitor NS-398 or sham (DMSO) treated. (i) Cellular ROS levels (DHE fluorescence intensity) in MAFs after treatment with/without 10 Gy IR and with NS-398. (j) 53BP1 foci frequencies in MAFs treated with/without 10Gy IR and either scrambled siRNA or one of two siRNAs against COX-2. (k) CELL-ROX fluorescence in MAFs after COX-2 siRNA treatment. One representative experiment out of four per cell type and treatment is shown. (l) Scheme of the bystander experiment. wt or nfkb1−/− MAFs were irradiated to induce senescence and then co-cultured with reporter cells expressing a 53BP1-GFP fusion protein. (m) DNA damage foci in senescent MAFs of the indicated genotype (left, shown by 53BP1 immunofluorescence in red) and in co-cultured reporter fibroblasts (right, foci also contain green 53BP1-GFP fusion protein). (n) Senescent nfkb1−/− MAFs induce more DNA damage in non-senescent bystander cells than senescent wt MAFs. 53BP1-GFP foci frequencies in bystander fibroblasts after the indicated times of co-culture are shown.
Figure 5
Figure 5. Inflammation causes telomere dysfunction and senescence in vivo.
All data are M±s.e.m. from 5-6 animals per group. Significant differences (ANOVA with post-hoc Holm-Sidak test, P<0.05) to control (young) animals of the same genotype are indicated by *, and between wt and transgenic animals at the same age/treatment by #. (a) Representative immunoFISH image from a crypt cross-section (nfkb1−/−, 36 weeks). (b) Representative immunoFISH image from a nfkb1−/− hepatocyte nucleus at 36 weeks of age. In (a) and (b), images are maximum intensity projections of at least 60 planes. Amplified images on the right are from single Z planes where colocalization was found. Graphs represent quantification of γH2A.X and telomere signals in selected regions of interest (dotted lines). Scale bar: 10 μm. (c) Frequencies of TAF in hepatocytes from nfkb1−/− and wt livers at the indicated ages. 32 weeks old animals received either 8 weeks ibuprofen or sham treatment. (d) Frequencies of TAF in nfkb1−/− and wt intestinal crypt enterocytes at the indicated ages. 32 weeks old animals received either 8 weeks ibuprofen or sham treatment. (e) TAF frequencies in livers from p55Δns/Δns mice at 20 weeks of age. (f) Representative 4-HNE immunohistochemistry in wt (top) and nfkb1−/− (bottom) liver (centrilobular area). (g) Frequencies of 4-HNE-positive hepatocytes at the indicated ages. (h) Representative double immunofluorescence image of nfkb1−/− liver. green: γH2AX, red: 4-HNE, blue: DAPI. Cells that are both positive for γH2AX+ and 4-HNE+ are marked by arrows. (i) Frequencies of TAF in hepatocytes from nfkb1−/− and wt livers at 12 weeks of age. Animals received either 4 weeks BHA or sham treatment. (j) Expression of oxidative stress-related genes in liver (qPCR array) of wt, nfkb1−/− and late generation terc−/− mice, n=4 per group. All genes that are significantly changed (P<0.05) in at least one group are shown. (k) NF-κB activity in wt, nfkb1−/− and late generation terc−/− liver tissue. (l) Expression of NF-κB target genes in wt and late generation terc−/− liver (qPCR array). n=4 per group. All genes that are significantly changed (P<0.05) in at least one group are shown. Gene names in green: expression changed in the same direction in nfkb1−/− and terc−/− livers. Gene names in red: expression changed in opposite direction (comp. Fig. 1h).
Figure 6
Figure 6. Accumulation of senescent cells predicts lifespan in mice over a wide range of interventions.
(a) Maximum lifespan of males in different cohorts of mice under AL feeding and dietary restriction (DR). See Methods for cohort description. (bf) Frequencies of senescent centrilobular hepatocytes measured as γH2AX+ PCNA cells (b), cells with >1 TAF (c), with >2TAFs (d), Sen-β-Gal positive cells (e) or 4-HNE- positive cells (f) versus relative age (calculated as % of maximum lifespan completed). Symbol colours indicate the same strains as in (a), triangle indicates a strain under dietary restriction. Data are M±s.e.m. from at least 3 mice per age group. (g) Maximum lifespan per cohort versus rate of accumulation of senescent hepatocytes, calculated by linear regression of senescent cell frequencies against age. Symbol outlines indicate strain/condition as before. Symbol fills indicate the senescence marker used: outline colour: γ-H2AX+ PCNA, pink: sen-β-Gal, white: >1TAF, grey: >2TAFs. (h) Maximum lifespan versus rate of accumulation of senescent crypt enterocytes. Symbols as before.

References

    1. Chung H. Y. et al.. Molecular inflammation: underpinnings of aging and age-related diseases. Ageing Res Rev. 8, 18–30 (2009). - PMC - PubMed
    1. Franceschi C. et al.. Inflammaging and anti-inflammaging: a systemic perspective on aging and longevity emerged from studies in humans. Mech. Ageing Dev. 128, 92–105 (2007). - PubMed
    1. Zhang G. et al.. Hypothalamic programming of systemic ageing involving IKK-beta, NF-kappaB and GnRH. Nature 497, 211–216 (2013). - PMC - PubMed
    1. Adler A. S. et al.. Motif module map reveals enforcement of aging by continual NF-kB activity. Genes Dev. 21, 3244–3257 (2007). - PMC - PubMed
    1. Kawahara T. L. A. et al.. SIRT6 links histone H3 lysine 9 deacetylation to NF-κB-dependent gene expression and organismal life span. Cell 136, 62–74 (2009). - PMC - PubMed

Publication types

MeSH terms