

Low-dose T₃ replacement restores depressed cardiac T₃ levels, preserves coronary microvasculature and attenuates cardiac dysfunction in experimental diabetes mellitus
- PMID: 24960246
- PMCID: PMC4153843
- DOI: 10.2119/molmed.2013.00040
Low-dose T₃ replacement restores depressed cardiac T₃ levels, preserves coronary microvasculature and attenuates cardiac dysfunction in experimental diabetes mellitus
Abstract
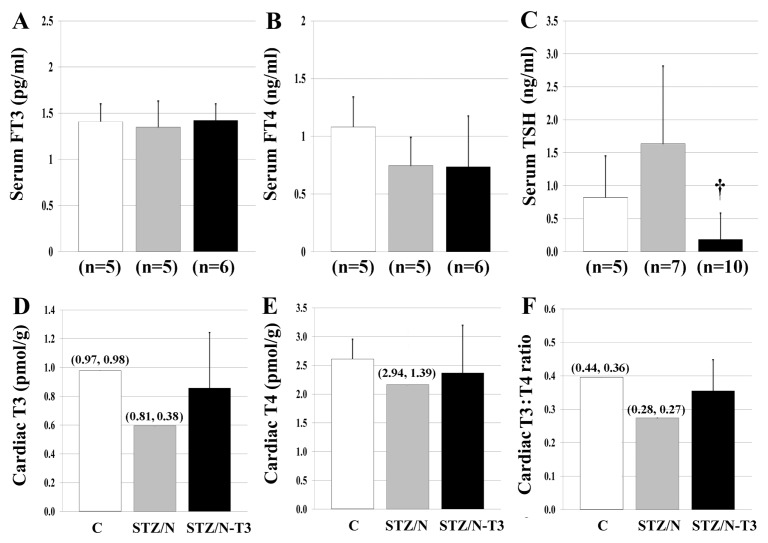
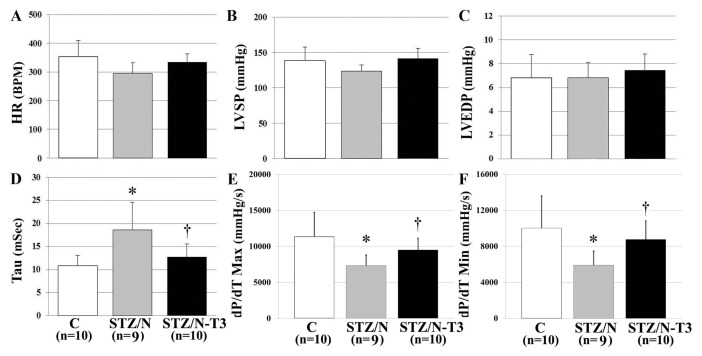
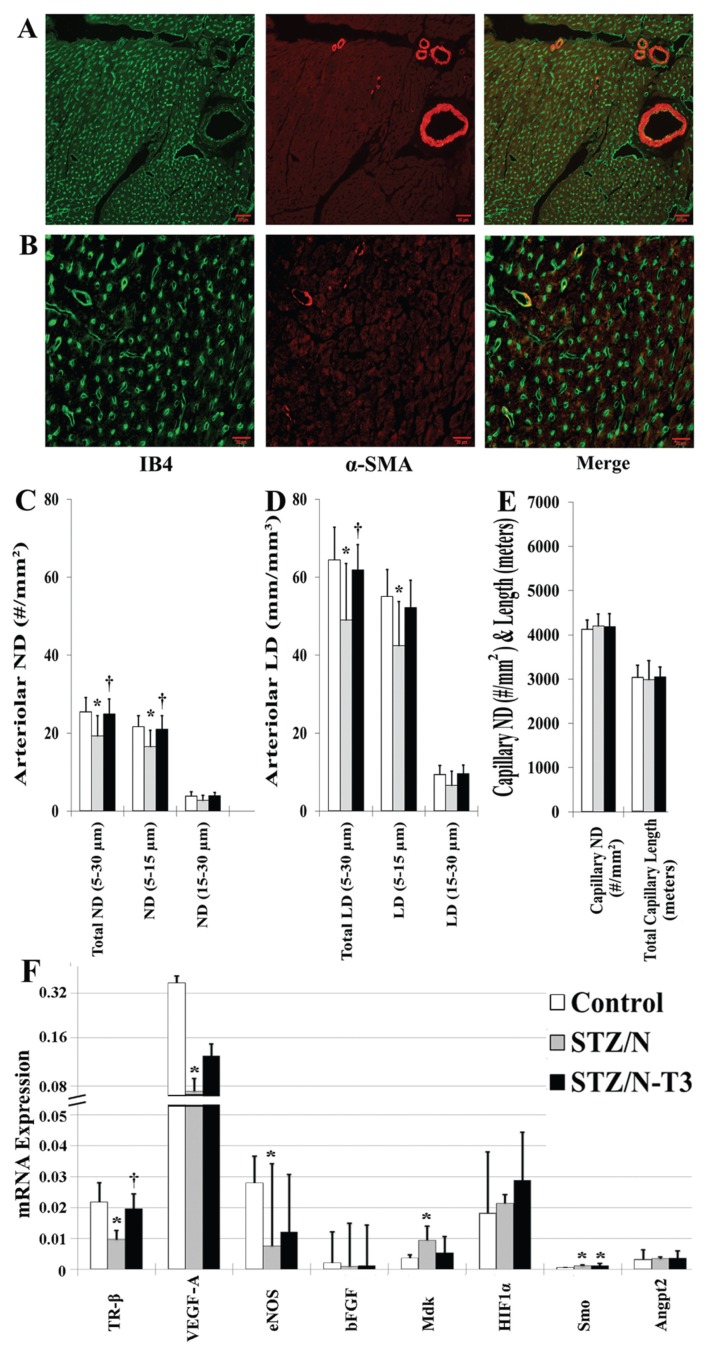
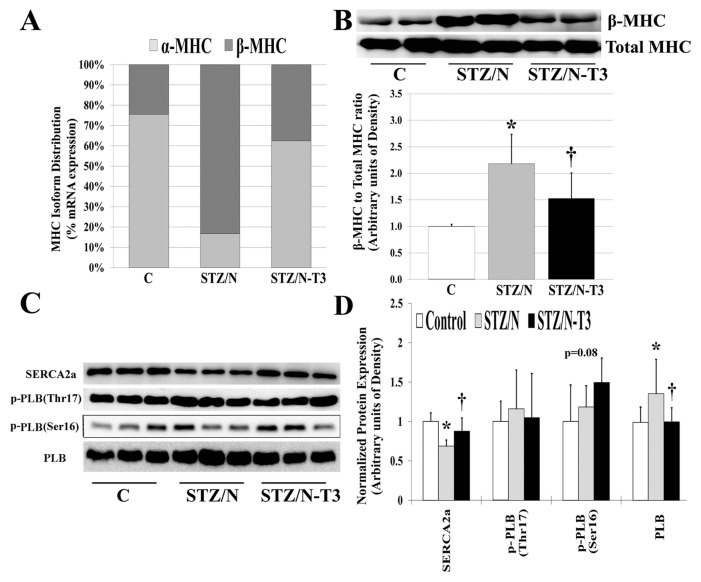
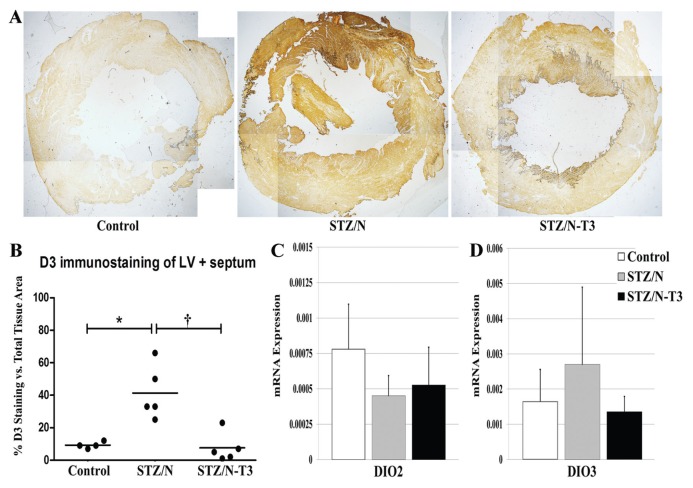
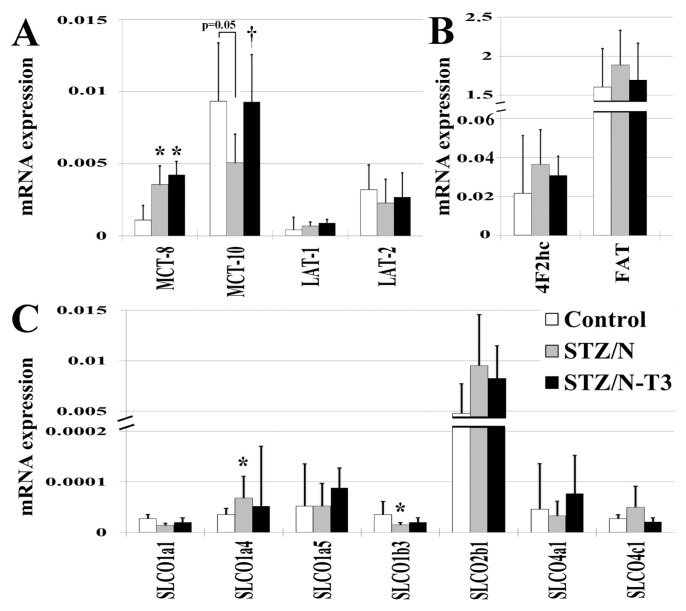
Thyroid dysfunction is common in individuals with diabetes mellitus (DM) and may contribute to the associated cardiac dysfunction. However, little is known about the extent and pathophysiological consequences of low thyroid conditions on the heart in DM. DM was induced in adult female Sprague Dawley (SD) rats by injection of nicotinamide (N; 200 mg/kg) followed by streptozotocin (STZ; 65 mg/kg). One month after STZ/N, rats were randomized to the following groups (N = 10/group): STZ/N or STZ/N + 0.03 μg/mL T3; age-matched vehicle-treated rats served as nondiabetic controls (C). After 2 months of T3 treatment (3 months post-DM induction), left ventricular (LV) function was assessed by echocardiography and LV pressure measurements. Despite normal serum thyroid hormone (TH) levels, STZ/N treatment resulted in reductions in myocardial tissue content of THs (T3 and T4: 39% and 17% reduction versus C, respectively). Tissue hypothyroidism in the DM hearts was associated with increased DIO3 deiodinase (which converts THs to inactive metabolites) altered TH transporter expression, reexpression of the fetal gene phenotype, reduced arteriolar resistance vessel density, and diminished cardiac function. Low-dose T3 replacement largely restored cardiac tissue TH levels (T3 and T4: 43% and 10% increase versus STZ/N, respectively), improved cardiac function, reversed fetal gene expression and preserved the arteriolar resistance vessel network without causing overt symptoms of hyperthyroidism. We conclude that cardiac dysfunction in chronic DM may be associated with tissue hypothyroidism despite normal serum TH levels. Low-dose T3 replacement appears to be a safe and effective adjunct therapy to attenuate and/or reverse cardiac remodeling and dysfunction induced by experimental DM.
Figures
Similar articles
-
Thyroid hormone improves the mechanical performance of the post-infarcted diabetic myocardium: a response associated with up-regulation of Akt/mTOR and AMPK activation.Metabolism. 2013 Oct;62(10):1387-93. doi: 10.1016/j.metabol.2013.05.008. Epub 2013 Jun 15. Metabolism. 2013. PMID: 23773982
-
Restoration of cardiac tissue thyroid hormone status in experimental hypothyroidism: a dose-response study in female rats.Endocrinology. 2013 Jul;154(7):2542-52. doi: 10.1210/en.2012-2087. Epub 2013 Apr 17. Endocrinology. 2013. PMID: 23594789 Free PMC article.
-
Thyroid hormone can favorably remodel the diabetic myocardium after acute myocardial infarction.Mol Cell Biochem. 2010 Dec;345(1-2):161-9. doi: 10.1007/s11010-010-0569-4. Epub 2010 Aug 22. Mol Cell Biochem. 2010. PMID: 20730619
-
Thyroid hormones and heart failure.Heart Fail Rev. 2016 Jul;21(4):361-4. doi: 10.1007/s10741-016-9556-5. Heart Fail Rev. 2016. PMID: 27098905 Review.
-
Thyroid hormone and "cardiac metamorphosis": potential therapeutic implications.Pharmacol Ther. 2008 May;118(2):277-94. doi: 10.1016/j.pharmthera.2008.02.011. Epub 2008 Mar 20. Pharmacol Ther. 2008. PMID: 18455802 Review.
Cited by
-
Selenium and Selenoproteins at the Intersection of Type 2 Diabetes and Thyroid Pathophysiology.Antioxidants (Basel). 2022 Jun 16;11(6):1188. doi: 10.3390/antiox11061188. Antioxidants (Basel). 2022. PMID: 35740085 Free PMC article. Review.
-
Update on clinical and experimental management of diabetic cardiomyopathy: addressing current and future therapy.Front Endocrinol (Lausanne). 2024 Jul 30;15:1451100. doi: 10.3389/fendo.2024.1451100. eCollection 2024. Front Endocrinol (Lausanne). 2024. PMID: 39140033 Free PMC article. Review.
-
BNP as a New Biomarker of Cardiac Thyroid Hormone Function.Front Physiol. 2020 Jul 9;11:729. doi: 10.3389/fphys.2020.00729. eCollection 2020. Front Physiol. 2020. PMID: 32733267 Free PMC article.
-
Adverse transverse-tubule remodeling in a rat model of heart failure is attenuated with low-dose triiodothyronine treatment.Mol Med. 2019 Dec 6;25(1):53. doi: 10.1186/s10020-019-0120-3. Mol Med. 2019. PMID: 31810440 Free PMC article.
-
Hormone treatments in congestive heart failure.J Int Med Res. 2018 Jun;46(6):2063-2081. doi: 10.1177/0300060518761262. Epub 2018 Feb 22. J Int Med Res. 2018. PMID: 29468912 Free PMC article. Review.
References
-
- Kannel W. Lipids, diabetes, and coronary heart disease: insights from the Framingham study. Am Heart J. 1985;110:1110–7. - PubMed
-
- Falcao-Pires I, Leite-Moreira A. Diabetic cardiomyopathy: understanding the molecular and cellular basis to progress in diagnosis and treatment. Heart Fail Rev. 2011;17:325–44. - PubMed
-
- Yoon Y, et al. Progressive attenuation of myocardial vascular endothelial growth factor expression is a seminal event in diabetic cardiomyopathy - Restoration of microvascular homeostasis and recovery of cardiac function in diabetic cardiomyopathy after replenishment of local vascular endothelial growth factor. Circulation. 2005;111:2073–85. - PubMed
Publication types
MeSH terms
Substances
Grants and funding
LinkOut - more resources
Full Text Sources
Other Literature Sources
Medical
Molecular Biology Databases
