Linking chemical electron-proton transfer to proton pumping in cytochrome c oxidase: broken-symmetry DFT exploration of intermediates along the catalytic reaction pathway of the iron-copper dinuclear complex
- PMID: 24960612
- PMCID: PMC4095914
- DOI: 10.1021/ic500363h
Linking chemical electron-proton transfer to proton pumping in cytochrome c oxidase: broken-symmetry DFT exploration of intermediates along the catalytic reaction pathway of the iron-copper dinuclear complex
Abstract
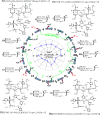
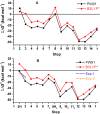
After a summary of the problem of coupling electron and proton transfer to proton pumping in cytochrome c oxidase, we present the results of our earlier and recent density functional theory calculations for the dinuclear Fe-a3-CuB reaction center in this enzyme. A specific catalytic reaction wheel diagram is constructed from the calculations, based on the structures and relative energies of the intermediate states of the reaction cycle. A larger family of tautomers/protonation states is generated compared to our earlier work, and a new lowest-energy pathway is proposed. The entire reaction cycle is calculated for the new smaller model (about 185-190 atoms), and two selected arcs of the wheel are chosen for calculations using a larger model (about 205 atoms). We compare the structural and redox energetics and protonation calculations with available experimental data. The reaction cycle map that we have built is positioned for further improvement and testing against experiment.
Figures


Similar articles
-
Coupled transport of electrons and protons in a bacterial cytochrome c oxidase-DFT calculated properties compared to structures and spectroscopies.Phys Chem Chem Phys. 2020 Dec 7;22(46):26652-26668. doi: 10.1039/d0cp04848h. Phys Chem Chem Phys. 2020. PMID: 33231596 Free PMC article.
-
Toward a chemical mechanism of proton pumping by the B-type cytochrome c oxidases: application of density functional theory to cytochrome ba3 of Thermus thermophilus.J Am Chem Soc. 2008 Nov 12;130(45):15002-21. doi: 10.1021/ja803112w. Epub 2008 Oct 17. J Am Chem Soc. 2008. PMID: 18928258 Free PMC article.
-
Density functional study for the bridged dinuclear center based on a high-resolution X-ray crystal structure of ba3 cytochrome c oxidase from Thermus thermophilus.Inorg Chem. 2013 Dec 16;52(24):14072-88. doi: 10.1021/ic401858s. Epub 2013 Nov 21. Inorg Chem. 2013. PMID: 24262070 Free PMC article.
-
Cytochrome c oxidase: catalytic cycle and mechanisms of proton pumping--a discussion.Biochemistry. 1999 Nov 16;38(46):15129-40. doi: 10.1021/bi9910934. Biochemistry. 1999. PMID: 10563795 Review.
-
A cooperative model for proton pumping in cytochrome c oxidase.Biochim Biophys Acta. 2004 Apr 12;1655(1-3):353-64. doi: 10.1016/j.bbabio.2003.06.002. Biochim Biophys Acta. 2004. PMID: 15100051 Review.
Cited by
-
Broken-Symmetry DFT Computations for the Reaction Pathway of IspH, an Iron-Sulfur Enzyme in Pathogenic Bacteria.Inorg Chem. 2015 Jul 6;54(13):6439-61. doi: 10.1021/acs.inorgchem.5b00751. Epub 2015 Jun 22. Inorg Chem. 2015. PMID: 26098647 Free PMC article.
-
Geometric and Electronic Structure Contributions to O-O Cleavage and the Resultant Intermediate Generated in Heme-Copper Oxidases.J Am Chem Soc. 2019 Jun 26;141(25):10068-10081. doi: 10.1021/jacs.9b04271. Epub 2019 Jun 17. J Am Chem Soc. 2019. PMID: 31146528 Free PMC article.
-
Why copper is preferred over iron for oxygen activation and reduction in haem-copper oxidases.Nat Chem. 2017 Mar;9(3):257-263. doi: 10.1038/nchem.2643. Epub 2016 Nov 7. Nat Chem. 2017. PMID: 28221360 Free PMC article.
-
Use of Broken-Symmetry Density Functional Theory To Characterize the IspH Oxidized State: Implications for IspH Mechanism and Inhibition.J Chem Theory Comput. 2014 Sep 9;10(9):3871-3884. doi: 10.1021/ct5005214. Epub 2014 Aug 13. J Chem Theory Comput. 2014. PMID: 25221444 Free PMC article.
-
Coupled transport of electrons and protons in a bacterial cytochrome c oxidase-DFT calculated properties compared to structures and spectroscopies.Phys Chem Chem Phys. 2020 Dec 7;22(46):26652-26668. doi: 10.1039/d0cp04848h. Phys Chem Chem Phys. 2020. PMID: 33231596 Free PMC article.
References
Publication types
MeSH terms
Substances
Grants and funding
LinkOut - more resources
Full Text Sources
Other Literature Sources
Medical

