. 2014 Jun 23;29(6):662-73.
doi: 10.1016/j.devcel.2014.04.024.

Hs3st3-modified heparan sulfate controls KIT+ progenitor expansion by regulating 3-O-sulfotransferases

Affiliations

Hs3st3-modified heparan sulfate controls KIT+ progenitor expansion by regulating 3-O-sulfotransferases

Vaishali N Patel et al. Dev Cell. .

Abstract

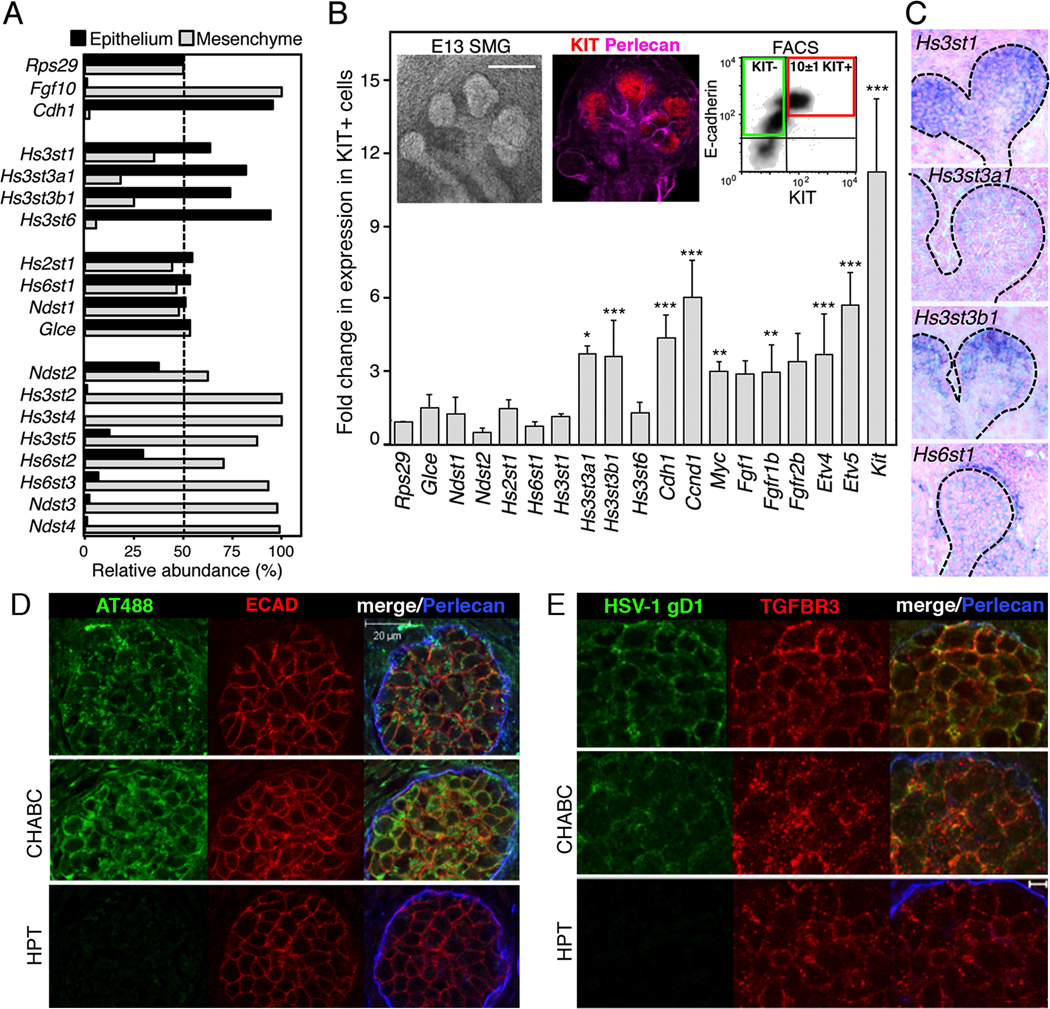
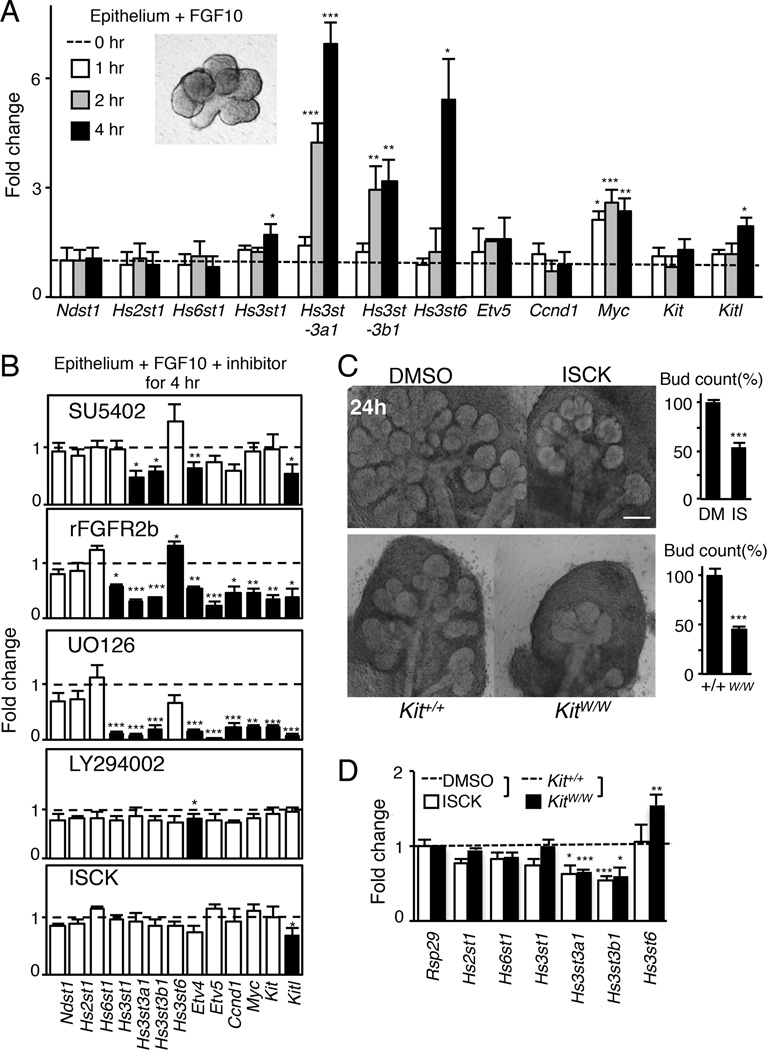
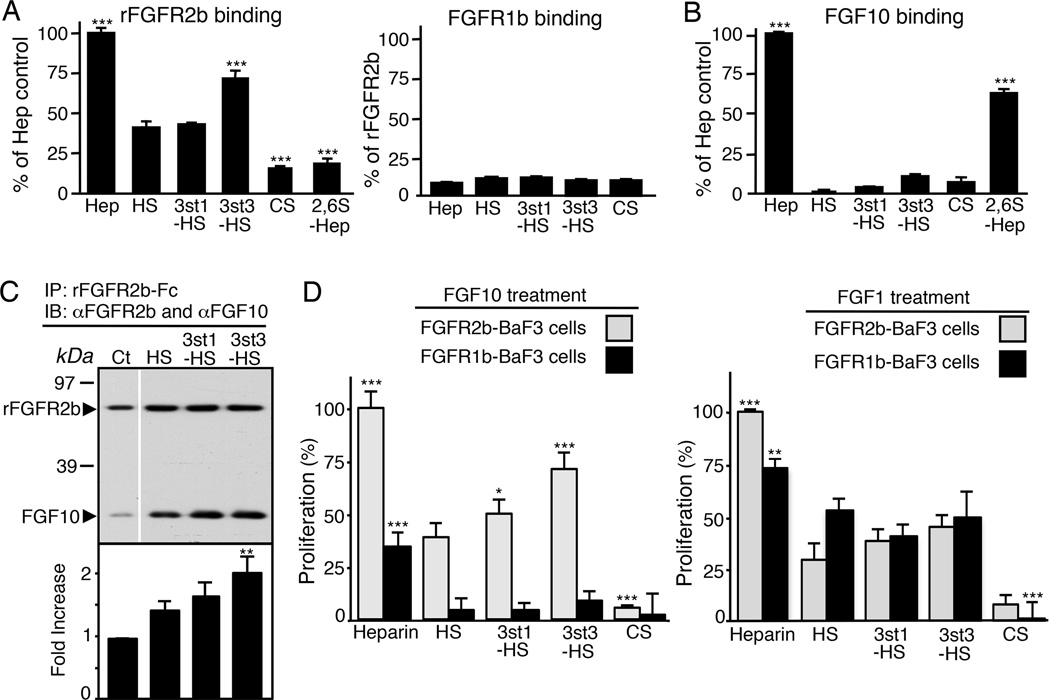
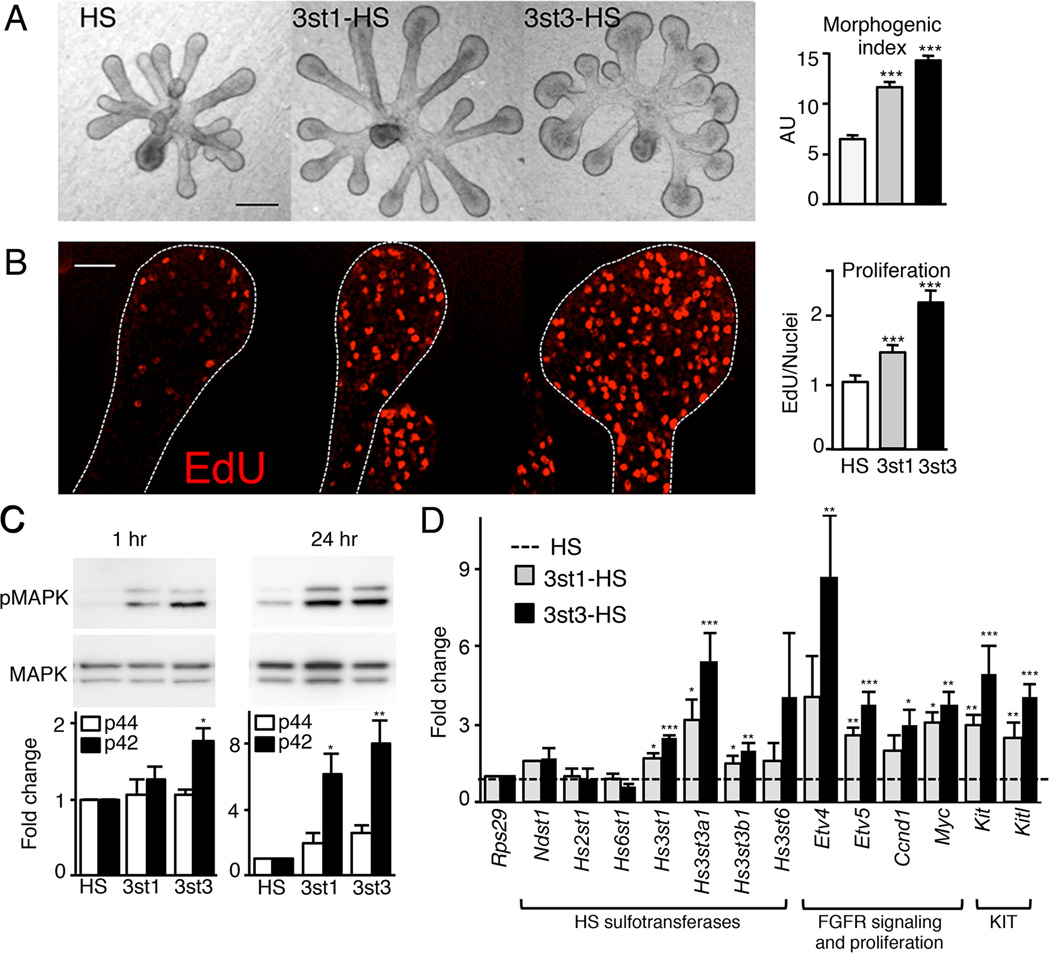
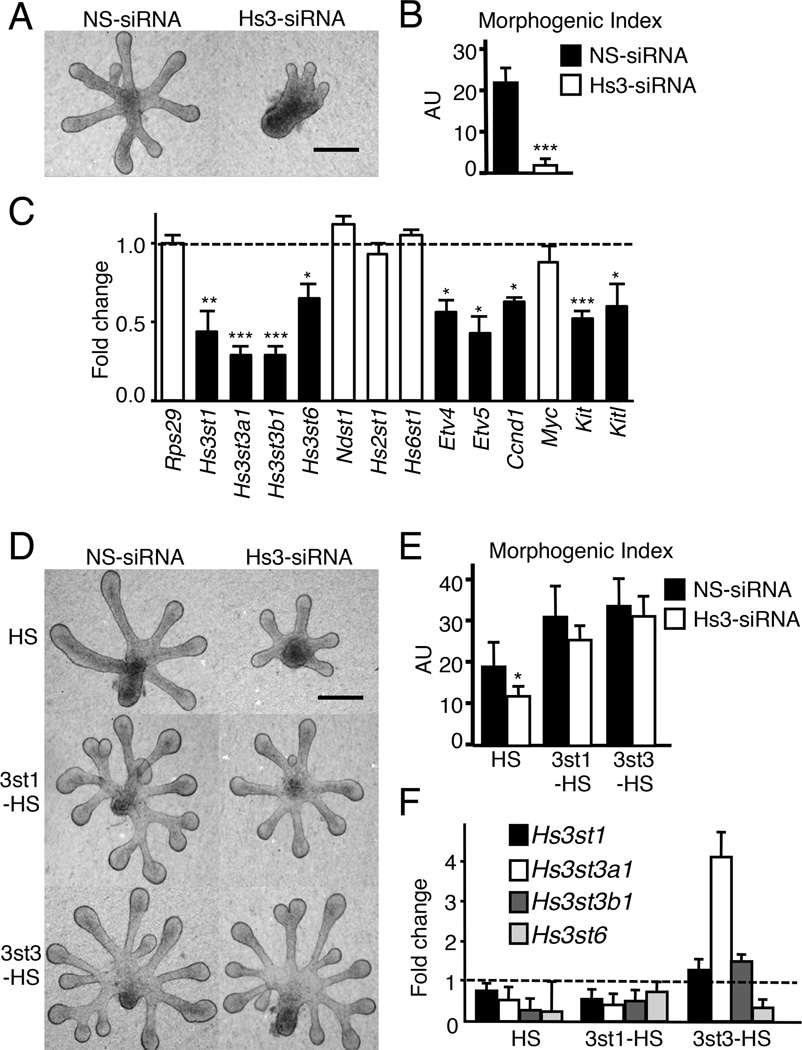
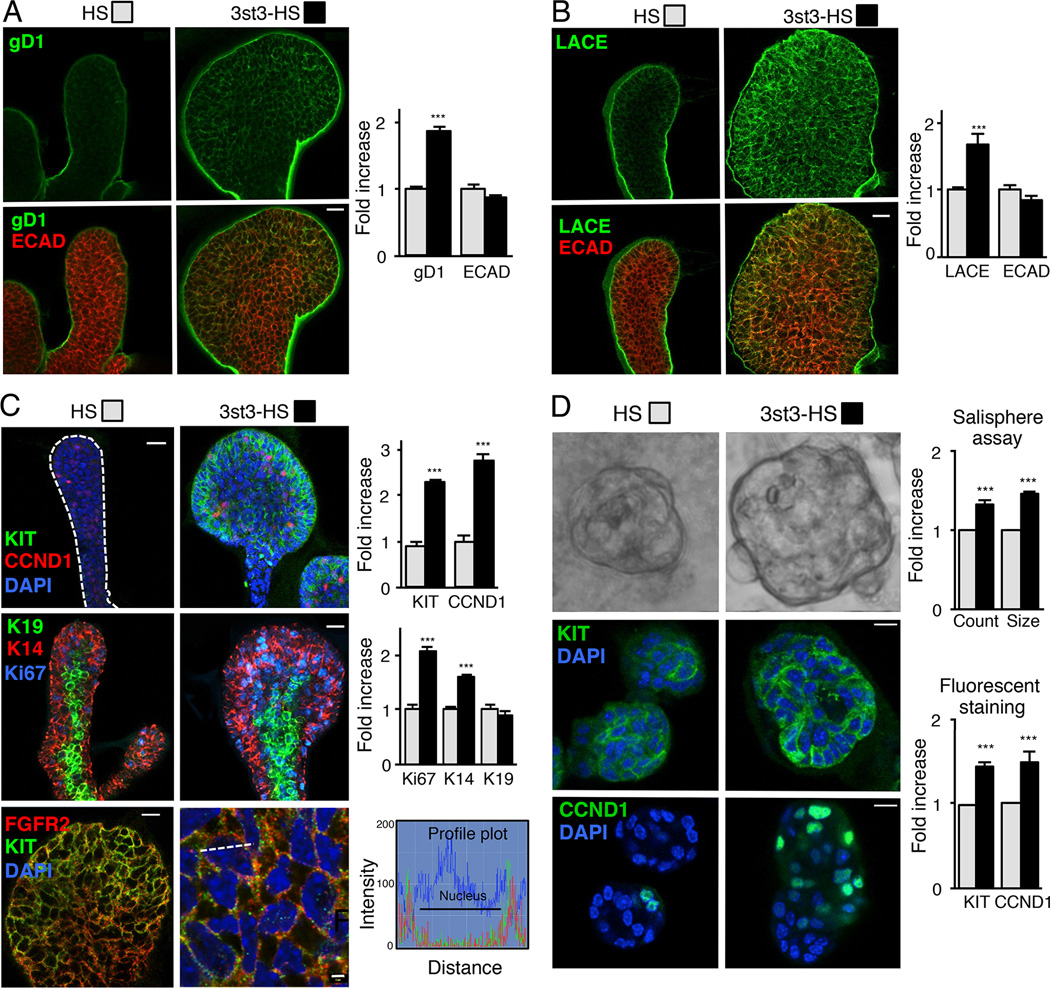
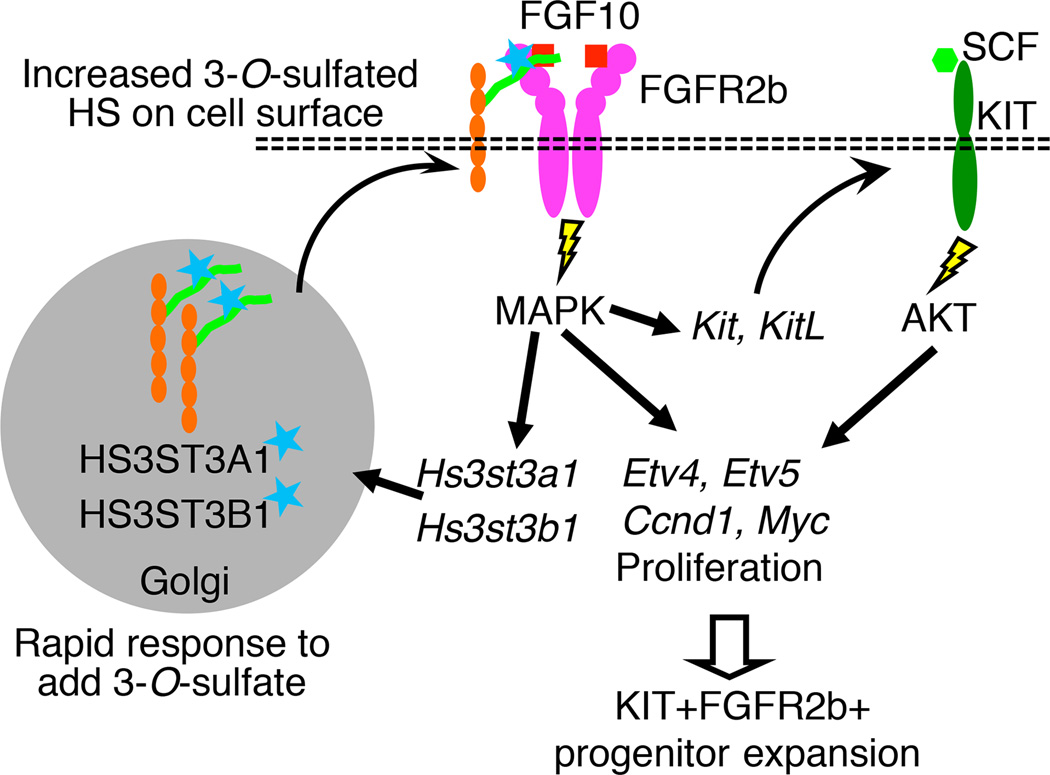
The exquisite control of growth factor function by heparan sulfate (HS) is dictated by tremendous structural heterogeneity of sulfated modifications. How specific HS structures control growth factor-dependent progenitor expansion during organogenesis is unknown. We isolated KIT+ progenitors from fetal salivary glands during a stage of rapid progenitor expansion and profiled HS biosynthetic enzyme expression. Enzymes generating a specific type of 3-O-sulfated-HS (3-O-HS) are enriched, and fibroblast growth factor 10 (FGF10)/FGF receptor 2b (FGFR2b) signaling directly regulates their expression. Bioengineered 3-O-HS binds FGFR2b and stabilizes FGF10/FGFR2b complexes in a receptor- and growth factor-specific manner. Rapid autocrine feedback increases 3-O-HS, KIT, and progenitor expansion. Knockdown of multiple Hs3st isoforms limits fetal progenitor expansion but is rescued with bioengineered 3-O-HS, which also increases adult progenitor expansion. Altering specific 3-O-sulfated epitopes provides a mechanism to rapidly respond to FGFR2b signaling and control progenitor expansion. 3-O-HS may expand KIT+ progenitors in vitro for regenerative therapy.


Figures

Figure 1
Figure 1. KIT+ epithelial endbud progenitors are enriched for HS 3-O-sulfotransferase expression and 3-O-HS is localized in the epithelial endbuds
(A) qPCR analysis of isolated E13 SMG epithelia and mesenchyme. Gene expression was normalized to Rps29. (B) The expression levels of HS biosynthetic enzymes were compared by qPCR in cDNA from the KIT+ versus KIT− ECAD+ FACS sorted cells. Gene expression was normalized to expression in the KIT− cells and Rps29. A false discovery rate (Q) for multiple unpaired t-tests was set to 5%. *p ≤ 0.05 **p ≤ 0.01 and ***p ≤ 0.001. Error bars: SEM. Images are single confocal projection with KIT (red) and Perlecan (pink) labeling in an E13 SMG. Scale bar; 200 µm. FACS plot shows KIT+ ECAD+ cells (red box) and KIT− ECAD+ cells (green box) sorted from E13 SMGs. (C) Sections of whole-mount in situ analysis of E13 SMG confirm the localization of Hs3st isoforms in the endbud (dotted line); counterstained with nuclear fast red. (D) Staining of E13 SMGs with labeled antithrombin (AT488, green). Heparitinase (HPT) but not chondroitinase (CHABC) treatment for 2 hr abolished AT488 labeling. Perlecan (blue) localized in the basement membrane and ECAD (red) labeled the epithelium. Images are single confocal sections, scale bar: 20 µm. (E) Staining with HSV-1 gD285 protein localized Hs3st3-type 3-O-HS at the epithelial cell surface. Heparitinase treatment also decreased binding of HSV-1 gD (green). Perlecan (blue) and TGFBR3 (red), which stains the epithelium, are shown. Images are single confocal sections, scale bar: 5 µm. See also Figure S1.
Figure 2
Figure 2. Hs3st expression is rapidly regulated by FGFR2b-dependent MAPK signaling and is reduced when KIT signaling is reduced
(A) Isolated E13 epithelia (insert image) were treated with 400 ng/ml FGF10 for 1, 2 or 4 hr, which does not affect morphogenesis. Gene expression was normalized to epithelium at 0 hr and Rps29. (B) SMGs (E13) were treated for 4 hr with an FGFR inhibitor (SU5402, 5µM), recombinant FGFR2b (25nM), a MAPK inhibitor (UO126, 20µM), a PI3-K inhibitor (LY294002, 25µM) and a SCF/KIT inhibitor (ISCK03, 20µM). qPCR analysis was normalized to DMSO or rFGFR1b (a control for rFGFR2b). No morphological changes were observed between treatments after 4 hr (insert image). (C) Inhibition of KIT signaling in SMGs with a KIT inhibitor (ISCK03, 20µM) or in vivo using E14 KitW/W mice reduced SMG branching morphogenesis compared to controls. The bud count was normalized (%) to control. Scale bar; 200 µm. (D) SMGs (E13) either treated with a KIT inhibitor (ISCK03, 20µM) for 24 hr or isolated from E13 KitW/W mice have reduced expression of Hs3st3a1 and Hs3st3b1. Gene expression was normalized to DMSO-carrier control or wild-type control and Rps29. Error bars: SEM. ANOVA (A–C); Student t-test (D); * p < 0.05, ** p < 0.01 and *** p < 0.001.
Figure 3
Figure 3. 3st3-HS preferentially binds FGFR2b to increase ternary complex formation of FGF10/FGFR2b, and proliferation of FGFR2b-expressing BaF3 cells
(A–B) Binding of FGFR2b and FGFR1b (A) or FGF10 (B) to immobilized GAGS. FGFR2b, but not FGF10, specifically binds to immobilized 3st3-HS. ELISA assays were performed in triplicate and repeated at least three times. Error bars: SEM. (C) 3-O-HS increases the amount of FGF10 immunoprecipitated with FGFR2b. The intensity of the protein bands was normalized to FGFR2b and shown as a fold change in ratio of FGF10/FGFR2b. The graphs are 3 experiments combined and the blots from a representative experiment. (D) BaF3 cells expressing FGFR2b or FGFR1b were incubated with 25nM GAGS (CSA, heparin, HS, 3st1-HS, or 3st3-HS) and 50nM FGF10 or 5nM FGF1. After 40 hr, the relative cell proliferation (A490) was determined. Data were normalized to FGFR2b-BaF3 cells treated with FGF10 or FGF1 and heparin. Error bars: SEM. ANOVA; * p < 0.05, ** p < 0.01 and *** p < 0.001. See also Figure S2.
Figure 4
Figure 4. 3-O-sulfated-HS increases FGF10-dependent epithelial morphogenesis by increasing proliferation and FGFR2b-downstream gene expression
(A) FGF10 cultured E13 SMG epithelia treated with HS, 3st1-HS or 3st3-HS for 28 hr. 3st3-HS increased endbud morphogenesis of FGF10-treated epithelium compared to HS (control). Morphogenic index (endbud number × width × duct length, in AU) increases with addition of 3-O-HS. Scale bar; 50 µm. (B) Single confocal sections showing cell proliferation (red) in epithelia cultured for 28 hr. Quantification of fluorescence intensity normalized to total nuclei staining and expressed as a ratio to the HS treated epithelia. At least five epithelia/condition were used for quantification from three independent experiments. Scale bar; 10 µm. (C) 3st3-HS increased MAPK signaling within 1 hr and both 3st-HS maintained it at 24 hr in FGF10-cultured epithelia. Band intensity of pMAPK was normalized to total MAPK and expressed as a fold change in ratio compared to HS. The graphs are 3 experiments combined and the blots from a representative experiment. (D) Gene expression was measured by qPCR and normalized to epithelia cultured for 28 hr with HS and Rps29. Error bars: SEM. ANOVA; *p < 0.05; **p < 0.01, and ***p < 0.001. See also Figure S3.
Figure 5
Figure 5. Knockdown of Hs3sts decreases epithelial morphogenesis and Hs3st expression, which are both rescued by exogenous 3st3-HS
(A) Light micrographs of FGF10-cultured E12 SMG epithelia were treated for 40 hr with non-silencing (NS) or Hs3st siRNA. Scale bar; 50 µm. (B) Quantification of epithelial morphogenesis after 40 hr of siRNA transfection. Knockdown of the Hs3sts inhibited branching compared to NS-siRNA. Error bars SEM. ANOVA; ***p<0.001, compared to control. (C) Knockdown of Hs3sts decreased expression of Etv4, Etv5, Ccnd1, Myc, Kit and Kitl. Gene expression was measured by qPCR and normalized to NS-siRNA (dotted line). Error bars: SEM. Student’s t-test *p < 0.05; **p < 0.01, and ***p < 0.001. (D) Light micrographs of FGF10-cultured E12 SMG epithelia were treated with NS or Hs3st siRNA. Exogenous HS, 3st1-HS, or 3st3-HS was added to these cultures following 16 hr of siRNA-treatment. Scale bar; 50 µm. (E) Quantification of epithelial morphogenesis after 40 hr of siRNA transfection. Error bars: SEM. ANOVA; ***p<0.001, compared to epithelia treated with NS and HS. (F) Gene expression of Hs3st1, Hs3st3a1 and Hs3st3b1 is partially restored by 3st1-HS and 3st3-HS. Gene expression was measured by qPCR and normalized to NS-siRNA (dotted line). Error bars: SEM.
Figure 6
Figure 6. 3-O-sulfated-HS increases endogenous 3-O-HS, FGF10/FGFR2b-Fc binding, proliferation and KIT expression
(A–C) FGF10 cultured E13 SMG epithelia treated with HS or 3st3-HS for 28 hr were stained. (A) gD1 staining (green) or (B) with FGF10/FGFR2b-Fc (LACE assay, green) and ECAD (red). (C) CCND1, KIT (green) and DAPI (blue) top panels, K14 (red), K19 (green), Ki67 (blue) middle panels, and FGFR2 (red), KIT (green) and DAPI (blue) lower panels. The profile plots (lower right) quantify the relative intensity of the KIT and FGFR2 protein distribution at the position along the white dotted line in the overlay image. The fluorescence signal from anti-KIT-Cy2 colocalized with anti-FGFR2-Cy3 immunofluorescence signal with an overlap coefficient of r=0.54 ± 0.015. Images are 2 µm confocal sections. Scale bars: 10 µm and 2 µm in lower right panel. Quantification of fluorescence intensity normalized to total nuclei staining and expressed fold increase compared to HS treated epithelia. At least five epithelia from three independent experiments were used for quantification. (D) 3-O-HS treatment increases salisphere size (upper panel). Quantification of the number and diameter of salispheres formed after 3 days. 3-O-HS increases both the count and size of salispheres compared to HS. Confocal sections of salispheres cultured for 6 days with HS or 3st3-HS stained with KIT (green, middle panel) and CCND1 (green, lower panel). Quantification of KIT and CCND1 fluorescence intensity normalized to total nuclei staining and expressed as a fold increase compared to HS treated salispheres. At least five salispheres from each of three independent experiments were used for quantification. Scale bar; 10 µm. Error bars: SEM. Student’s t-test; *p < 0.05, **p < 0.01, and ***p < 0.001.
Figure 7
Figure 7
Rapidly altering 3-O-sulfation provides a cellular mechanism to modulate the response to FGFR2b signaling and control progenitor expansion. Model showing that 3-O-HS rapidly increases 3-O-sulfotranseferase expression, 3-O-sulfated HS on the epithelium and FGF10/FGFR2b complex formation, MAPK signaling, gene expression of FGFR2b signaling targets, proliferation genes, and Kit and its ligand, which expands the KIT+FGFR2b+ progenitors.

References

    1. Belleudi F, Leone L, Nobili V, Raffa S, Francescangeli F, Maggio M, Morrone S, Marchese C, Torrisi MR. Keratinocyte growth factor receptor ligands target the receptor to different intracellular pathways. Traffic. 2007;8:1854–1872. - PubMed
    1. Bishop JR, Schuksz M, Esko JD. Heparan sulphate proteoglycans fine-tune mammalian physiology. Nature. 2007;446:1030–1037. - PubMed
    1. Bui C, Ouzzine M, Talhaoui I, Sharp S, Prydz K, Coughtrie MW, Fournel-Gigleux S. Epigenetics: methylation-associated repression of heparan sulfate 3-O-sulfotransferase gene expression contributes to the invasive phenotype of H-EMC-SS chondrosarcoma cells. FASEB J. 2010;24:436–450. - PubMed
    1. Cool SM, Nurcombe V. Heparan sulfate regulation of progenitor cell fate. J. Cell Biochem. 2006;99:1040–1051. - PubMed
    1. Davies JA. Do different branching epithelia use a conserved developmental mechanism? Bioessays. 2002;24:937–948. - PubMed

Publication types

MeSH terms