. 2013 Mar 19;3(1):294-317.
doi: 10.3390/brainsci3010294.

NADPH oxidase and angiogenesis following endothelin-1 induced stroke in rats: role for nox2 in brain repair

Affiliations

NADPH oxidase and angiogenesis following endothelin-1 induced stroke in rats: role for nox2 in brain repair

Caroline J Taylor et al. Brain Sci. .

Abstract

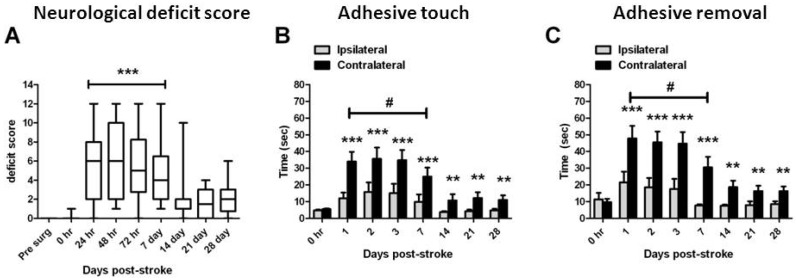
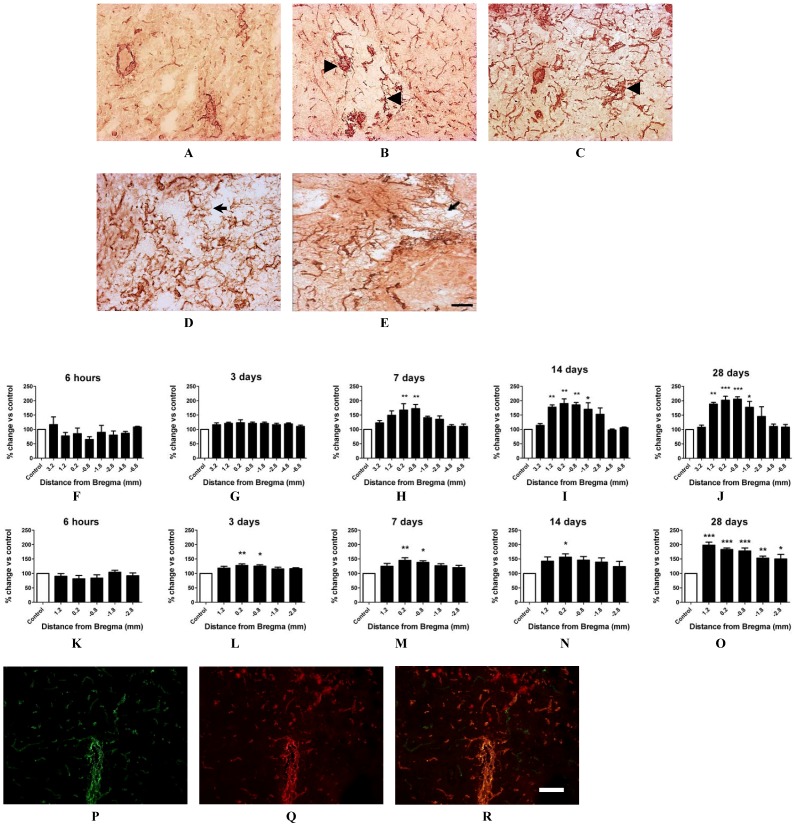
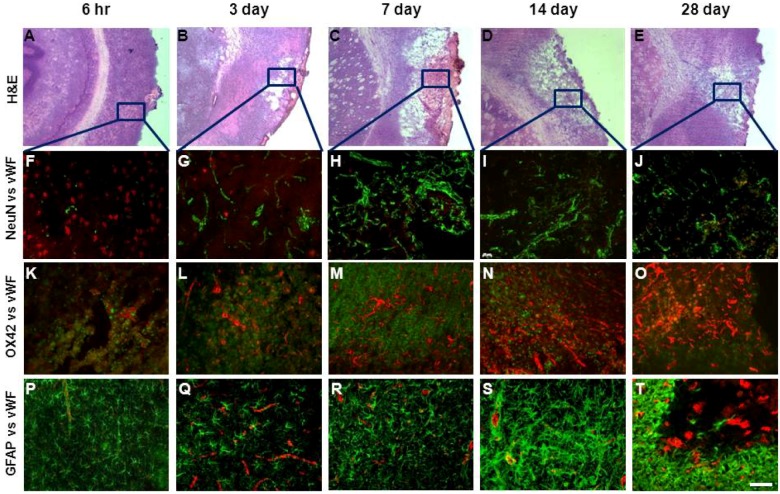
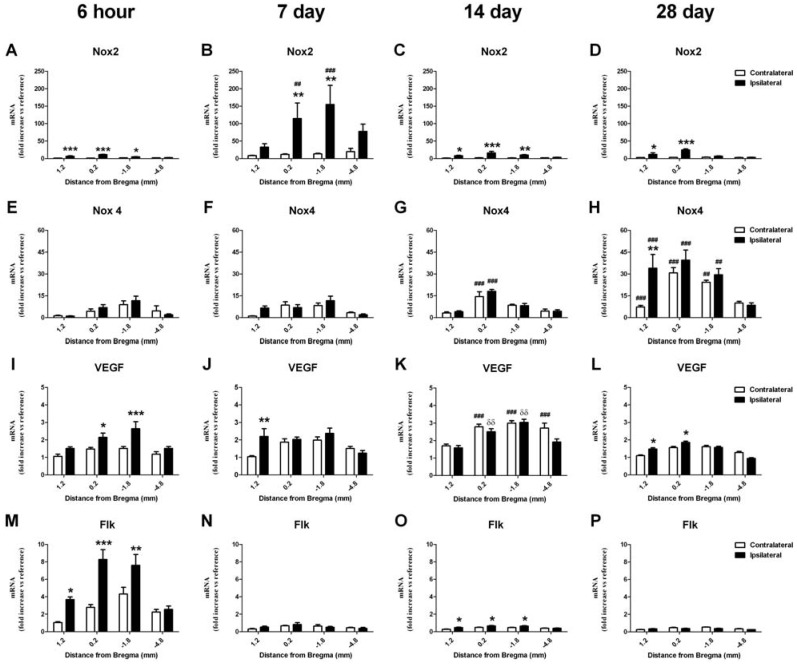
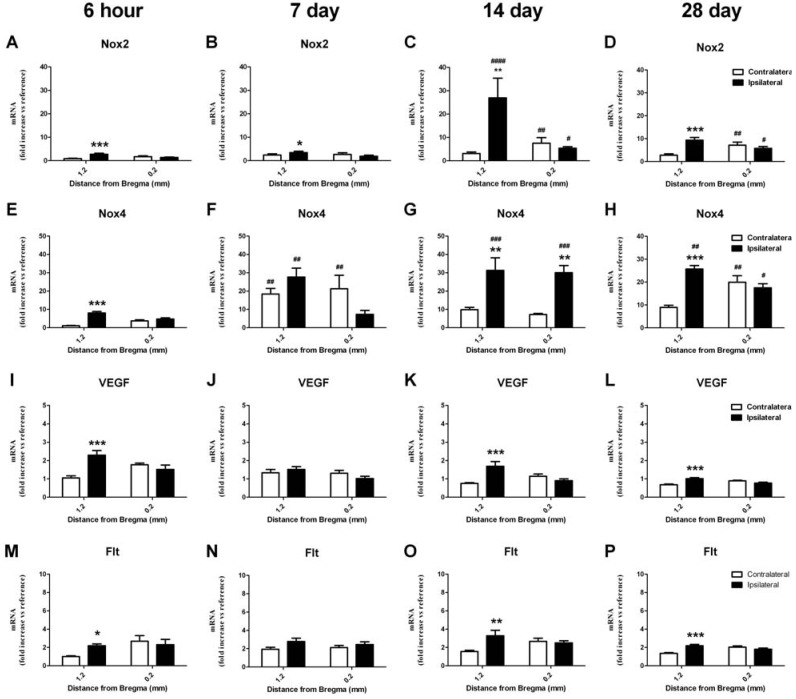
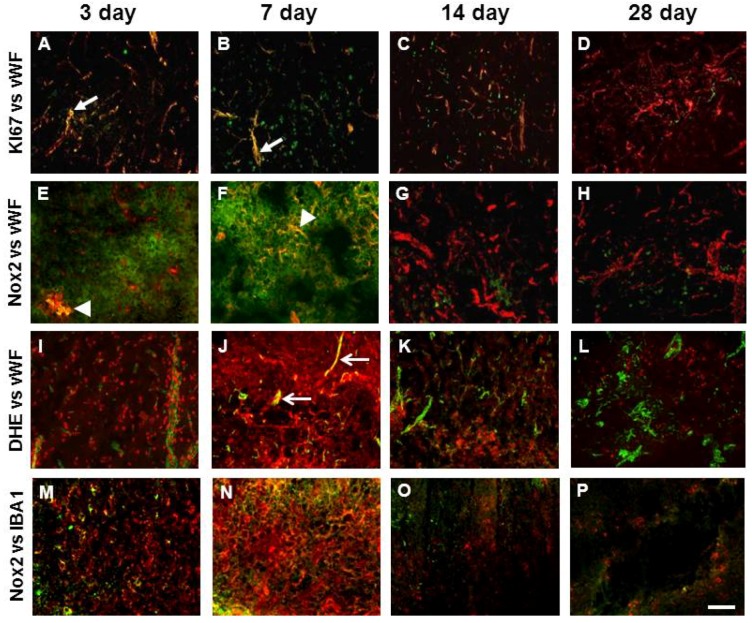
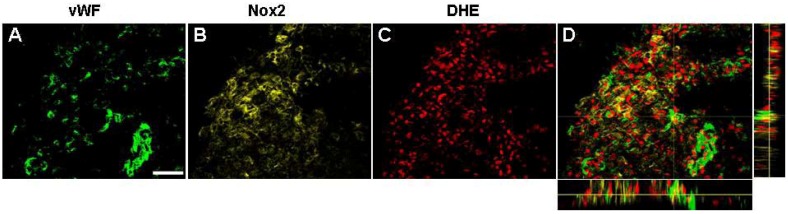
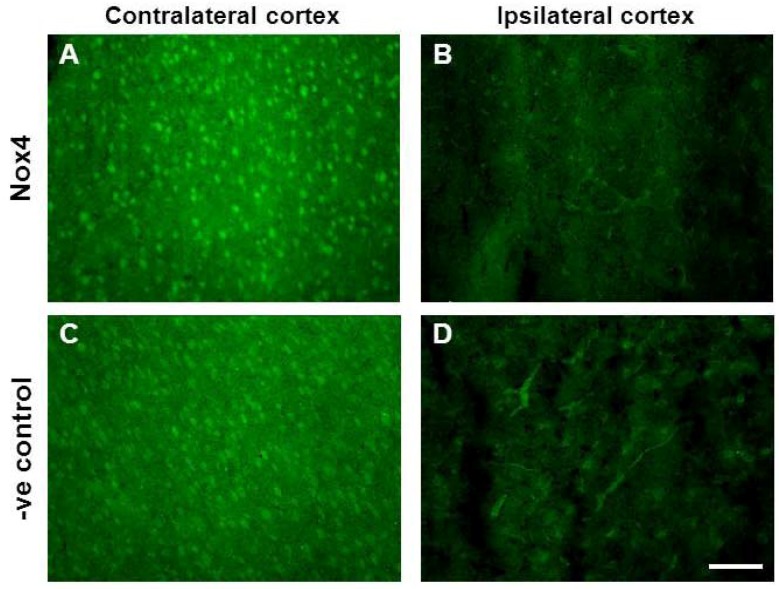
NADPH oxidases contribute to brain injury, yet they may also have a role in brain repair, particularly in vascular signaling and angiogenesis. This study determined the temporal and spatial profile of NADPH oxidase subunit expression/activity concurrently with angiogenesis in the brain following transient ischemic stroke induced by prolonged constriction of the middle cerebral artery by perivascular injection of endothelin-1 in conscious Hooded Wistar rats (n = 47). VEGF mRNA expression was increased in the ipsilateral cortex and striatum between 6 h and 28 days post-stroke concurrently with a marked increase in Nox2 mRNA expression up to 7 days, and increased Nox4 mRNA expression detected between 7 and 28 days. Point counting of blood vessels using Metamorph imaging software showed increased vascular sprouting between 3 and 7 days after stroke with new vascular networks detected in the core infarct region by 14 days. Angiogenic blood vessels 3 and 7 days post-stroke were observed to co-localise with both Nox2 antibody and dihydroethidium fluorescence suggesting a role for Nox2 generated superoxide during the phase of vascular remodeling, whilst Nox4 expression was detected once new cerebral vessels had formed. These results indicate for the first time that ROS signaling through a cerebrovascular Nox2 NADPH oxidase may be important in initiating brain angiogenesis.


Figures

Figure 1
Figure 1
Long term neurological outcomes following ET-1 induced stroke. Combined neurological deficit scores (A) from all rats assessed in this study up to 28 days. Data presented as box plots include hinges extending from the 25th to 75th percentiles, the median line within the box and whiskers extending to the minimum and maximum values of the dataset. *** p < 0.001 compared with pre-stroke scores (non-parametric ANOVA). Latency to touch (B) and remove (C) a sticky label on the contralateral (stroke affected) forelimb compared with the ipsilateral forelimb from all rats assessed up to 28 days after stroke. Data presented as mean ± S.E.M. of time taken to touch each stimulus and then remove the stimulus. ** p < 0.01; *** p < 0.001 compared with the ipsilateral forelimb at the same time measurement (RM ANOVA); # p < 0.05 compared with the ipsilateral forepaw at 0 h (RM ANOVA). n = 35 assessed 1–3 days; n = 26 assessed day 7; n = 16 assessed day 14; n = 8 assessed days 21 and 28 for all behavior studies.
Figure 2
Figure 2
Angiogenesis in the ET-1 induced stroke affected brain. Immunohistochemical photomicrographs of vWF staining in the ipsilateral core cortex at 6 h, 3, 7, 14 and 28 days post-stroke (AE respectively). Arrow heads indicate sprouting vessels and short arrows point to microvascular development by 14 and 28 days. Scale bar = 50 μM. Blood vessels were quantified in situ using vWF stained sections and point counted using Metamorph imaging software (F–O). A significant increase in the number of blood vessels was detected 7, 14 and 28 days after stroke in the ipsilateral core cortex (HJ respectively) and also at 3, 7, 14 and 28 days in the core ipsilateral striatum (LO respectively) in comparison to respective contralateral mirror regions [6 h (n = 4); 3 days (n = 5); 7 days (n = 6); 14 days (n = 4); and 28 days recovery (n = 4)]. Data presented as mean ± S.E.M. * p < 0.05, ** p < 0.01, *** p < 0.001 compared with the contralateral side expressed as 100% control; one way ANOVA. Immunofluorescent photomicrographs of vWF (P) and lectin stain (Q). Merged images (R) show significant co-localisation of both vWF and lectin stain following lectin tail vein infusion indicative of vessel patency. Scale bar = 100 μm.
Figure 3
Figure 3
Angiogenesis and lesion pathology following ET-1 induced stroke. Hematoxylin and Eosin (H & E) stained images of the infarcted cortex between 6 h and 28 days post-stroke (AE) were used to identify areas of interest for vWF, NeuN and OX42 histological analysis (as marked by frames). Merged immunofluorescent images of NeuN labeled neurons (red) and vWF labeled blood vessels (green) throughout the stroke affected cortex 6 h to 28 days after ET-1 induced stroke (FJ). Increased angiogenesis occurs in areas where there is greatest neuronal loss. Merged immunofluorescent images of vWF labelled blood vessels (red) with markers for microglia (OX42, green) (KO); and astrocytes (GFAP, green) (PT), 3, 7, 14 and 28 days post-stroke. Peak microglia activation occurs between 3 and 7 days whilst activated astrocytes are observed 3 days after stroke surrounding the damaged territory with intense staining detected by 14 days (S) that infiltrates into the core by 28 days (T). Scale bar = 100 μM.
Figure 4
Figure 4
Real-time PCR detection of mRNA for NADPH oxidase subunits, angiogenic factor VEGF and its receptor, Flk, in the cortex 6 h to 28 days after ET-1 induced stroke. Nox2 mRNA expression is increased in the ipsilateral cortex as early as 6 h after stroke and remains elevated for up to 28 days in comparison to the contralateral hemisphere (AD). Nox4 mRNA expression is also increased at 14 and 28 days post-stroke in both the ipsilateral and contralateral hemisphere in comparison to the 6 h group, with a greater increase detected in the ipsilateral hemisphere at 28 days (EH). An increase in the angiogenic factor VEGF mRNA is detected in the ipsilateral cortex 6 hours after stroke and remains elevated for up to 28 days, with elevated levels also detected in the contralateral hemisphere at 14 days when compared to the 6 h group (IL). An increase in VEGF receptor Flk mRNA after stroke is detected in the ipsilateral hemisphere but only at 6 h (MP). Expression of mRNA was normalized to the respective GAPDH content for each sample (ΔCt), then expressed relative to the contralateral side of the brain at 1.2 mm from Bregma, 6 h post-stroke (ΔΔCt). Data are presented as mean SEM of 8 samples per region (n = 4 per group). * p < 0.05; ** p < 0.01; *** p < 0.001 vs. contralateral; # p < 0.05; ## p < 0.01; ### p < 0.001 vs. corresponding ipsilateral 6 h value; δδ p < 0.01 vs. corresponding contralateral 6 h value (ANOVA).
Figure 5
Figure 5
Real-time PCR detection of mRNA for NADPH oxidase subunits, angiogenic factor VEGF and its receptor, Flk, in the striatum 6 h to 28 days after ET-1 induced stroke. Nox2 mRNA expression is increased in the ipsilateral striatum as early as 6 h after stroke and remains elevated for up to 28 days in comparison to the contralateral hemisphere (AD). Nox4 mRNA expression is also increased at 6 h in the ipsilateral striatum and remains elevated for up to 28 days post-stroke, with increases in both the ipsilateral and contralateral hemispheres detected at 7 and 28 days in comparison to the 6 h group (EH). An increase in the angiogenic factor VEGF is detected in the ipsilateral striatum at 6 hand remains elevated for up to 28 days (IL). An increase in VEGF receptor Flt mRNA after stroke is detected 6 h, 14 and 28 days after stroke in the ipsilateral hemisphere (MP). Expression of mRNA was normalized to the respective GAPDH content for each sample (ΔCt), then expressed relative to the contralateral side of the brain at 1.2 mm from Bregma, 6 h post-stroke (ΔΔCt). Data are presented as mean SEM of 8 samples per region (n = 4 per group). * p < 0.05; ** p < 0.01; *** p < 0.001 vs. contralateral; # p < 0.05; ## p < 0.01; ### p < 0.001 vs. corresponding ipsilateral 6 h value; δ p < 0.05 vs. corresponding contralateral 6 h value (ANOVA).
Figure 6
Figure 6
Nox2 immunohistochemistry in the stroke affected cortex is associated with proliferating blood vessels in addition to inflammatory cells. Merged immunofluorescent images of vWF labelled blood vessels (red) throughout the stroke affected cortex up to 28 days after ET-1 induced stroke co-localised with: the proliferation marker Ki67 (green) (AD); a Nox2 antibody gp91Phox (green) (EH); and the superoxide indicator DHE (IL). Co-localisation (yellow) for Ki67 can be observed between 3 and 14 days after stroke (A and B, arrows) with little overlap observed by 28 days (D). Nox2 and vWF double labelling (yellow) can be seen 3 and 7 days after stroke (E and F, arrow heads) with little overlap detected beyond this time. DHE and vWF are also observed to co-localise at 3 and 7 days after stroke (I and J, open arrows). Merged immunofluorescent images of Nox2 (green) co-localisation with rabbit polyclonal IBA1 marker for activated microglia (red) (MP). Scale bar = 100 μm.
Figure 7
Figure 7
Newly formed blood vessels are positive for Nox2 and superoxide. Confocal microscopy of triple labelled immunofluorescence for vWF (green) (A), Nox2 (yellow) (B), and DHE (red) (C), in the damaged cortex shows new blood vessels are positive for both Nox2 and superoxide 7 days post stroke (Orthogonal view D). Images were captured as collapsed reconstructions of optical sections every 0.2 μm on the z-axis. Scale bar = 50 μm
Figure 8
Figure 8
Nox4 immunohistochemistry in the ipsilateral cortex 28 days after stroke. Immunofluorescent images of rabbit monoclonal Nox4 antibody (Epitomics) in the contralateral (A) and ipsilateral (B) (Stroke affected) cortex 28 days post-stroke. Adjacent immunofluorescent images of control rabbit IgG serum in the contralateral (C) and ipsilateral (D) cortex reveal a high degree of non-specific immunoreactivity to blood vessels and neurons alike. Scale bar = 100 μm.

References

    1. Gauthier L.V., Taub E., Perkins C., Ortmann M., Mark V.W., Uswatte G. Remodeling the brain: Plastic structural brain changes produced by different motor therapies after stroke. Stroke. 2008;39:1520–1525. doi: 10.1161/STROKEAHA.107.502229. - DOI - PMC - PubMed
    1. Zhang R., Zhang Z., Wang L., Wang Y., Gousev A., Zhang L., Ho K.L., Morshead C., Chopp M. Activated neural stem cells contribute to stroke-induced neurogenesis and neuroblast migration toward the infarct boundary in adult rats. J. Cereb. Blood Flow Metab. 2004;2:441–448. - PubMed
    1. Minger S.L., Ekonomou A., Carta E.M., Chinoy A., Perry R.H., Ballard C.G. Endogenous neurogenesis in the human brain following cerebral infarction. Regen. Med. 2007;2:69–74. doi: 10.2217/17460751.2.1.69. - DOI - PubMed
    1. Ergul A., Alhusban A., Fagan S.C. Angiogenesis: A harmonized target for recovery after stroke. Stroke. 2012;43:2270–2274. doi: 10.1161/STROKEAHA.111.642710. - DOI - PMC - PubMed
    1. Wang L., Zhang Z., Wang Y., Zhang R., Chopp M. Treatment of stroke with erythropoietin enhances neurogenesis and angiogenesis and improves neurological function in rats. Stroke. 2007;35:1732–1737. - PubMed

LinkOut - more resources