. 2014 Jul 8;111(27):9869-74.
doi: 10.1073/pnas.1400447111. Epub 2014 Jun 24.

Defining a personal, allele-specific, and single-molecule long-read transcriptome

Affiliations

Defining a personal, allele-specific, and single-molecule long-read transcriptome

Hagen Tilgner et al. Proc Natl Acad Sci U S A. .

Abstract

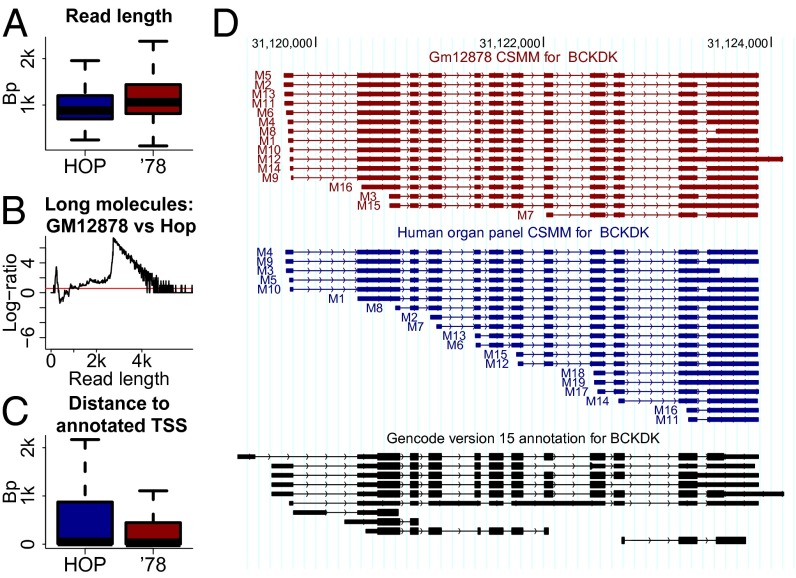
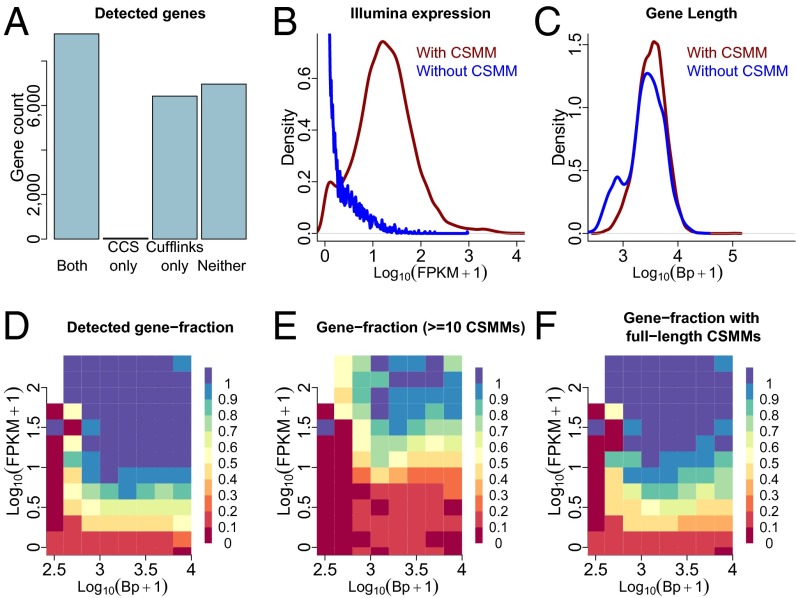
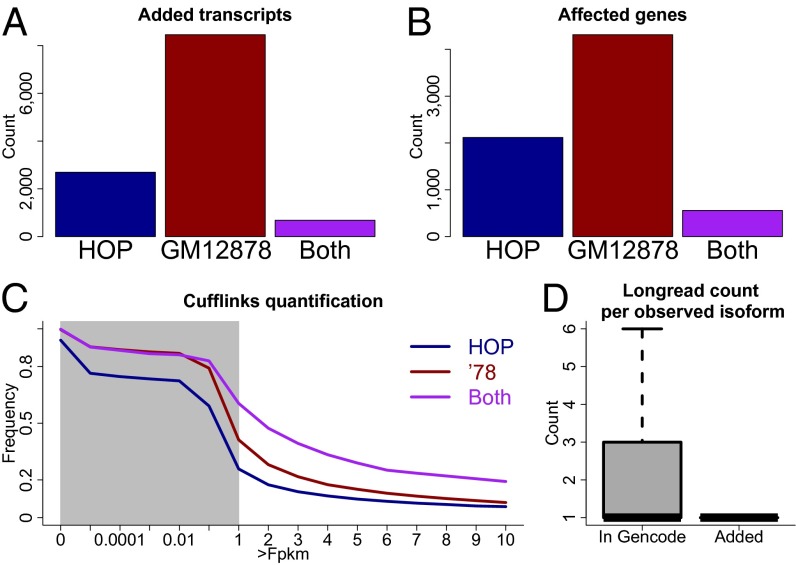
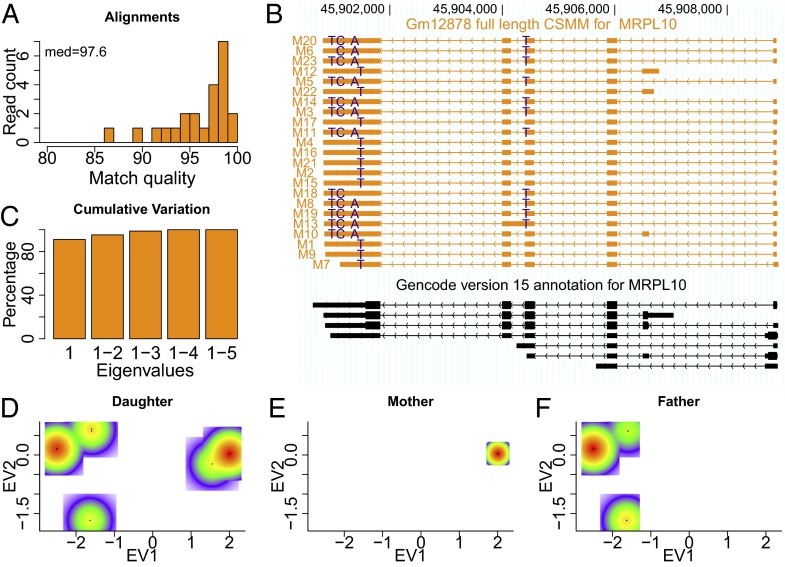
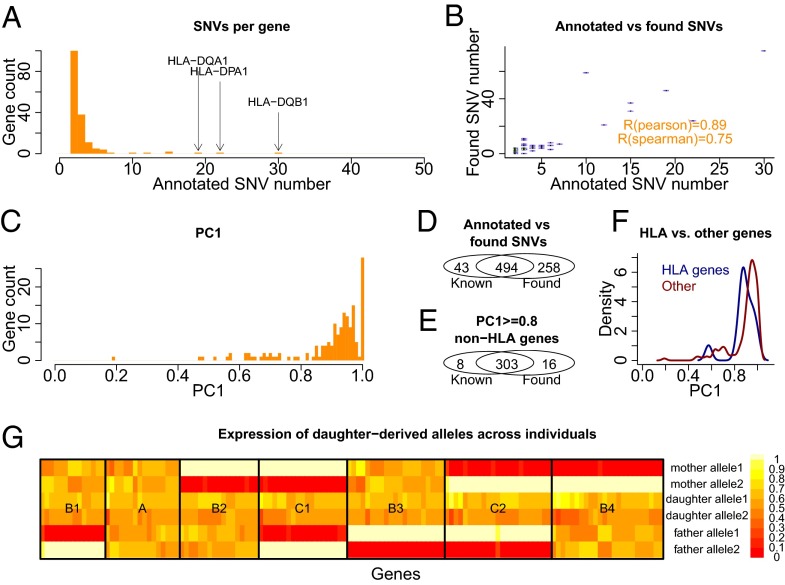
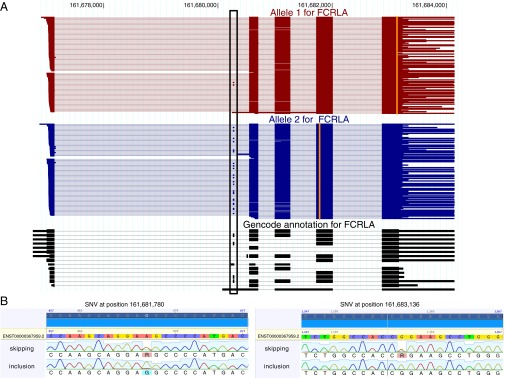
Personal transcriptomes in which all of an individual's genetic variants (e.g., single nucleotide variants) and transcript isoforms (transcription start sites, splice sites, and polyA sites) are defined and quantified for full-length transcripts are expected to be important for understanding individual biology and disease, but have not been described previously. To obtain such transcriptomes, we sequenced the lymphoblastoid transcriptomes of three family members (GM12878 and the parents GM12891 and GM12892) by using a Pacific Biosciences long-read approach complemented with Illumina 101-bp sequencing and made the following observations. First, we found that reads representing all splice sites of a transcript are evident for most sufficiently expressed genes ≤3 kb and often for genes longer than that. Second, we added and quantified previously unidentified splicing isoforms to an existing annotation, thus creating the first personalized annotation to our knowledge. Third, we determined SNVs in a de novo manner and connected them to RNA haplotypes, including HLA haplotypes, thereby assigning single full-length RNA molecules to their transcribed allele, and demonstrated Mendelian inheritance of RNA molecules. Fourth, we show how RNA molecules can be linked to personal variants on a one-by-one basis, which allows us to assess differential allelic expression (DAE) and differential allelic isoforms (DAI) from the phased full-length isoform reads. The DAI method is largely independent of the distance between exon and SNV--in contrast to fragmentation-based methods. Overall, in addition to improving eukaryotic transcriptome annotation, these results describe, to our knowledge, the first large-scale and full-length personal transcriptome.

Keywords: allele-specific expression; alternative splicing; isoform sequencing; personalized medicine; platform comparison.


Conflict of interest statement

Conflict of interest statement: M.P.S. is on the scientific advisory board of Personalis and GenapSys.

Figures

Fig. 1.
Fig. 1.
Increased length of CCS for the GM12878 sample. (A) Length distribution of CCS reads in the human organ panel (Hop; blue) (11) and CCS sequenced here for the GM12878 cell line (red). (B) Relative representation of molecules in length bins in the two samples. y axis is calculated as log [(number of GM12878-CCS in bin + 1)/(number of Hop-CCS in bin +1)]. The red horizontal line gives the expected ratio, which is above 0, because of the increased sequencing depth in GM12878. (C) Distribution of distances for CSMMs between the 5′ end of the mapping and the closest annotated TSS of the same gene for both the Hop (blue) and the GM12878 (red) sample. (D) All CSMMs mapped to the BCKDK gene in the GM12878 cell line (red) and in the Hop sample (blue) as well as all Gencode15-annoated transcripts for this gene (black).
Fig. 2.
Fig. 2.
Comparison of short- and long-read sequencing for gene identification. (A) Bar chart depicting the number of genes identified by PacBio-CCS and by Cufflinks, the number of genes only identified by the former, the number of genes only identified by the latter, and the number of genes identified by neither approach. (B) Cufflinks-derived gene expression distribution for genes that show at least one CSMM and for those that do not have a single CSMM. (C) Mature gene length distribution for genes that show at least one CSMM and for those that do not have a single CSMM. (D) Fraction of genes that show at least one CSMM in bins according to gene length and Cufflinks-derived gene expression. (E) Fraction of genes that show at least 10 CSMM in the same bins as in D. (F) Fraction of genes that show at least one full-length CSMM in the same bins as in (D). Note that a full-length CSMM does not necessarily correspond to the longest annotated isoform of the gene.
Fig. 3.
Fig. 3.
Construction and quantification of an enhanced annotation. (A) Bar plot of novel isoforms that originated from the Hop sample only, the GM12878 sample only, and those from both samples. (B) Bar plot of gene numbers that have at least one isoform originating from the Hop sample only, the GM12878 sample only, and from both samples. (C) Fraction of novel isoforms in the above three classes that are detected with different FPKM cutoffs. The gray area indicates the region where the x axis is logarithmic. To the right of the gray area the x axis is linear. (D) Boxplot for the number of PacBio molecules supporting alignments that correspond to entire or partial Gencode transcripts (as judged from their splice sites; Left) and the number of PacBio molecules supporting novel alignments (Right).
Fig. 4.
Fig. 4.
Phasing of a single gene. (A) Histogram of alignment qualities for all CSMMs to MRPL10 gene. (B) Alignments of CSMMs to the MRPL10 gene with heterozygous mismatches that differ from hg19 highlighted. (C) Bar chart of all cumulative eigenvalues. (D) Scatterplot of reads in the space defined by eigenvector 1 and eigenvector 2 for reads from the GM12878 cell line. Color scale from white (absence of reads) to red (strong enrichment of reads). (E) Same plot as in D but for reads from the cell line GM12892. (F) Same plot as in D but for reads from the cell line GM12891.
Fig. 5.
Fig. 5.
Phasing statistics for genes with multiple annotated heterozygous SNVs. (A) Histogram of annotated heterozygous SNV number for all considered genes. (B) Scatterplot of annotated heterozygous SNV number and found heterozygous SNV number for these genes. (C) Histogram of the ratio of the first eigenvalue and the sum of all eigenvalues (PC1). (D) Overlap between found and annotated SNVs for all considered genes. (E) Same plot as in D but excluding HLA genes and genes with a first principal component weaker than 0.8. (F) Distribution of PC1 contributions for non-HLA genes and HLA genes. (G) Map of relative expression ratios of the daughter-derived alleles I and II in mother, father, and daughter cell lines. Each row gives an allele in one of the individuals and each column gives a gene. Black boxes indicate different classes of genes according to expression patterns of allele I and II in the parents.
Fig. 6.
Fig. 6.
Differential allelic isoform use for the FCRLA gene. (A) From the previously defined alleles 1 and 2 for this gene, we deduced all full-length reads in all three cell lines (GM12878, GM12891, and GM12892) that could be attributed to these alleles. Reads for allele 1 (red), allele 2 (blue), and the annotation (black) are plotted in transcription direction. A black box highlights an alternatively included exon. Vertical orange lines indicate genomic positions at which reads differ from the reference genome through a heterozygous SNV. (B) Sanger sequencing traces for the two SNVs, which are located at genomic positions 161681780 (Left, position 867 in the Sanger trace) and 161683136 (Right, position 1357 in the Sanger trace) on chromosome 1, separated by RNA molecules skipping exon 2 (Upper, as given by a PCR from a primer spanning the exon 1-exon 3 junction, “skipping”) and including exon 2 (Lower, as given by a PCR from a primer spanning the exon 1-exon 2 junction, “inclusion”). The nucleotide descriptor “R” stands for a purine residue (A or G).

References

    1. Nagalakshmi U, et al. The transcriptional landscape of the yeast genome defined by RNA sequencing. Science. 2008;320(5881):1344–1349. - PMC - PubMed
    1. Wang ET, et al. Alternative isoform regulation in human tissue transcriptomes. Nature. 2008;456(7221):470–476. - PMC - PubMed
    1. Sultan M, et al. A global view of gene activity and alternative splicing by deep sequencing of the human transcriptome. Science. 2008;321(5891):956–960. - PubMed
    1. Mortazavi A, Williams BA, McCue K, Schaeffer L, Wold B. Mapping and quantifying mammalian transcriptomes by RNA-Seq. Nat Methods. 2008;5(7):621–628. - PubMed
    1. Wilhelm BT, et al. Dynamic repertoire of a eukaryotic transcriptome surveyed at single-nucleotide resolution. Nature. 2008;453(7199):1239–1243. - PubMed

Associated data