Impaired reduction of N2O to N2 in acid soils is due to a posttranscriptional interference with the expression of nosZ
- PMID: 24961695
- PMCID: PMC4073493
- DOI: 10.1128/mBio.01383-14
Impaired reduction of N2O to N2 in acid soils is due to a posttranscriptional interference with the expression of nosZ
Abstract
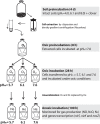
Accumulating empirical evidence over the last 60 years has shown that the reduction of N2O to N2 is impaired by low soil pH, suggesting that liming of acid soils may reduce N2O emissions. This option has not gained much momentum in global change research, however, possibly due to limited understanding of why low pH interferes with N2O reductase. We hypothesized that the reason is that denitrifying organisms in soils are unable to assemble functional N2O reductase (N2OR) at low pH, as shown to be the case for the model strain Paracoccus denitrificans. We tested this by experiments with bacteria extracted from soils by density gradient centrifugation. The soils were sampled from a long-term liming experiment (soil pH 4.0, 6.1, and 8.0). The cells were incubated (stirred batches, He atmosphere) at pH levels ranging from 5.7 to 7.6, while gas kinetics (NO, N2O, and N2) and abundances of relevant denitrification genes (nirS, nirK, and nosZ) and their transcripts were monitored. Cells from the most acidic soil (pH 4.0) were unable to reduce N2O at any pH. These results warrant a closer inspection of denitrification communities of very acidic soils. Cells from the neutral soils were unable to produce functional N2OR at pH values of ≤6.1, despite significant transcription of the nosZ gene. The N2OR expressed successfully at pH 7.0, however, was functional over the entire pH range tested (5.7 to 7.6). These observations lend strong support to our hypothesis: low soil pH diminishes/prevents reduction of N2O, primarily by precluding a successful assembly of functional N2O reductase.
Importance: Impaired N2O reduction in acid soils was first observed ~60 years ago, and the phenomenon has been rediscovered several times since then. The practical implication would be that the emissions of N2O from cropped soils could be controlled by soil pH management, but this option has largely been ignored till now. One reason for this could be that the mechanisms involved have remained obscure. Here, we provide compelling evidence that the primary reason is that low pH interferes with the making of the enzyme N2O reductase rather than the function of the enzyme if properly assembled. The implications are important for understanding how pH controls the kinetics of N2O and N2 production by denitrification. The improved understanding provides credibility for soil pH management as a way to mitigate N2O emissions.
Copyright © 2014 Liu et al.
Figures


Similar articles
-
Effect of pH on the denitrification proteome of the soil bacterium Paracoccus denitrificans PD1222.Sci Rep. 2021 Aug 26;11(1):17276. doi: 10.1038/s41598-021-96559-2. Sci Rep. 2021. PMID: 34446760 Free PMC article.
-
Transient Accumulation of NO2- and N2O during Denitrification Explained by Assuming Cell Diversification by Stochastic Transcription of Denitrification Genes.PLoS Comput Biol. 2016 Jan 5;12(1):e1004621. doi: 10.1371/journal.pcbi.1004621. eCollection 2016 Jan. PLoS Comput Biol. 2016. PMID: 26731685 Free PMC article.
-
Transcriptional and metabolic regulation of denitrification in Paracoccus denitrificans allows low but significant activity of nitrous oxide reductase under oxic conditions.Environ Microbiol. 2016 Sep;18(9):2951-63. doi: 10.1111/1462-2920.13128. Epub 2016 Jan 18. Environ Microbiol. 2016. PMID: 26568281
-
Recent progress in microbial production and consumption of nitrous oxide in agricultural soils.World J Microbiol Biotechnol. 2025 Jun 27;41(7):235. doi: 10.1007/s11274-025-04464-x. World J Microbiol Biotechnol. 2025. PMID: 40571888 Review.
-
Transcriptional and environmental control of bacterial denitrification and N2O emissions.FEMS Microbiol Lett. 2018 Mar 1;365(5). doi: 10.1093/femsle/fnx277. FEMS Microbiol Lett. 2018. PMID: 29272423 Review.
Cited by
-
Denitrification Biokinetics: Towards Optimization for Industrial Applications.Front Microbiol. 2021 May 5;12:610389. doi: 10.3389/fmicb.2021.610389. eCollection 2021. Front Microbiol. 2021. PMID: 34025593 Free PMC article.
-
High NO and N2O accumulation during nitrite denitrification in lab-scale sequencing batch reactor: influencing factors and mechanism.Environ Sci Pollut Res Int. 2019 Nov;26(33):34377-34387. doi: 10.1007/s11356-019-06391-5. Epub 2019 Oct 21. Environ Sci Pollut Res Int. 2019. PMID: 31637614
-
A Dual Enrichment Strategy Provides Soil- and Digestate-Competent Nitrous Oxide-Respiring Bacteria for Mitigating Climate Forcing in Agriculture.mBio. 2022 Jun 28;13(3):e0078822. doi: 10.1128/mbio.00788-22. Epub 2022 May 31. mBio. 2022. PMID: 35638872 Free PMC article.
-
Linking meta-omics to the kinetics of denitrification intermediates reveals pH-dependent causes of N2O emissions and nitrite accumulation in soil.ISME J. 2022 Jan;16(1):26-37. doi: 10.1038/s41396-021-01045-2. Epub 2021 Jul 1. ISME J. 2022. PMID: 34211102 Free PMC article.
-
Enhanced Nitrous Oxide Production in Denitrifying Dechloromonas aromatica Strain RCB Under Salt or Alkaline Stress Conditions.Front Microbiol. 2019 Jun 5;10:1203. doi: 10.3389/fmicb.2019.01203. eCollection 2019. Front Microbiol. 2019. PMID: 31275250 Free PMC article.
References
-
- Mosier AR. 1998. Soil processes and global change. Biol. Fertil. Soils 27:221–229. 10.1007/s003740050424 - DOI
-
- Ostrom NE, Sutka R, Ostrom PH, Grandy AS, Huizinga KM, Gandhi H, Von Fischer JC, Robertson GP. 2010. Isotopologue data reveal bacterial denitrification as the primary source of N2O during a high flux event following cultivation of a native temperate grassland. Soil Biol. Biochem. 42:499–506. 10.1016/j.soilbio.2009.12.003 - DOI
-
- Saggar S, Jha N, Deslippe J, Bolan NS, Luo J, Giltrap DL, Kim DG, Zaman M, Tillman RW. 2013. Denitrification and N2O:N2 production in temperate grasslands: processes, measurements, modelling and mitigating negative impacts. Sci. Total Environ. 465:173–195. 10.1016/j.scitotenv.2012.11.050 - DOI - PubMed
-
- Wijler J, Delwiche CC. 1954. Investigations on the denitrifying process in soil. Plant Soil 5:155–169. 10.1007/BF01343848 - DOI
MeSH terms
Substances
LinkOut - more resources
Full Text Sources
Other Literature Sources
