. 2014 Jul;141(13):2581-91.
doi: 10.1242/dev.098459.

Macrophages modulate adult zebrafish tail fin regeneration

Affiliations

Macrophages modulate adult zebrafish tail fin regeneration

Timothy A Petrie et al. Development. 2014 Jul.

Erratum in

  • Development. 2015 Jan 15;142(2):406. Tsung-Yang, Chao [corrected to Yang, Chao-Tsung]

Abstract

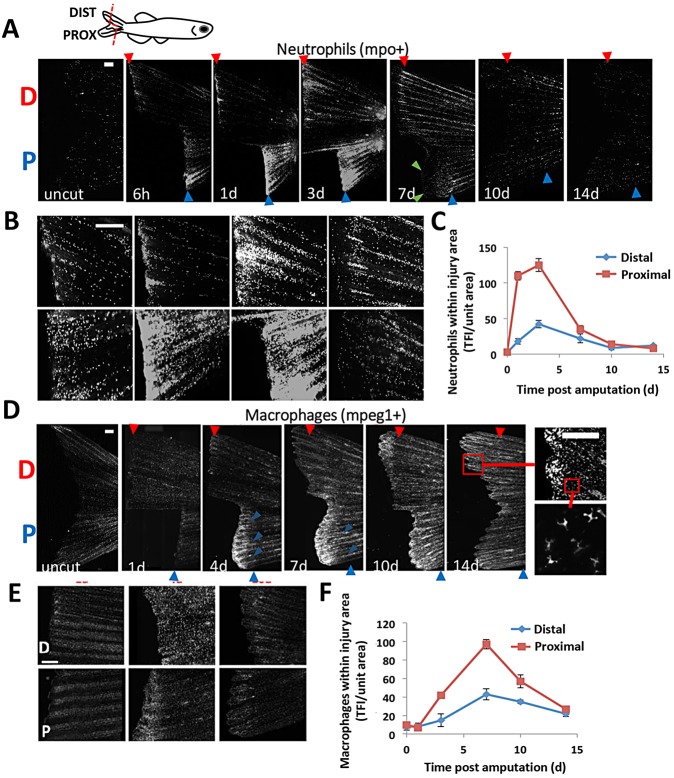
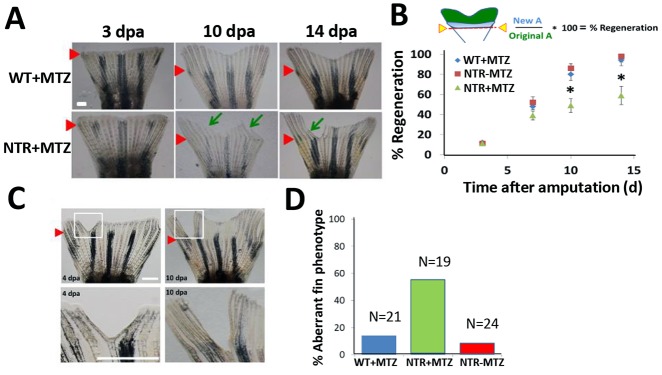
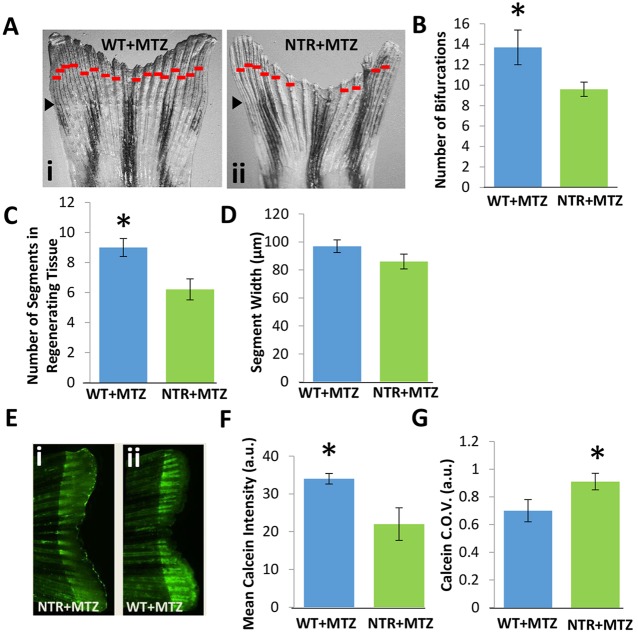
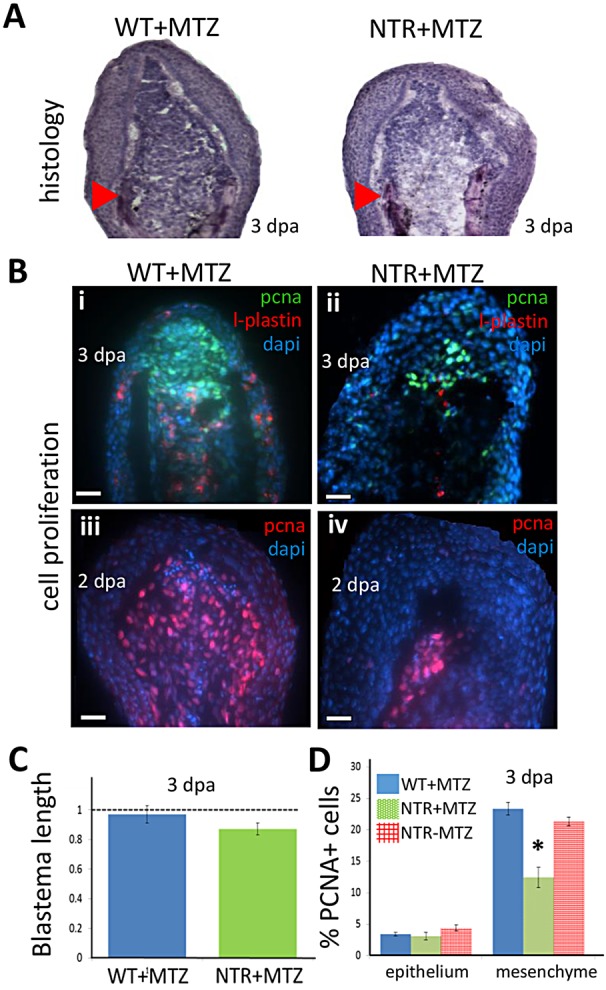
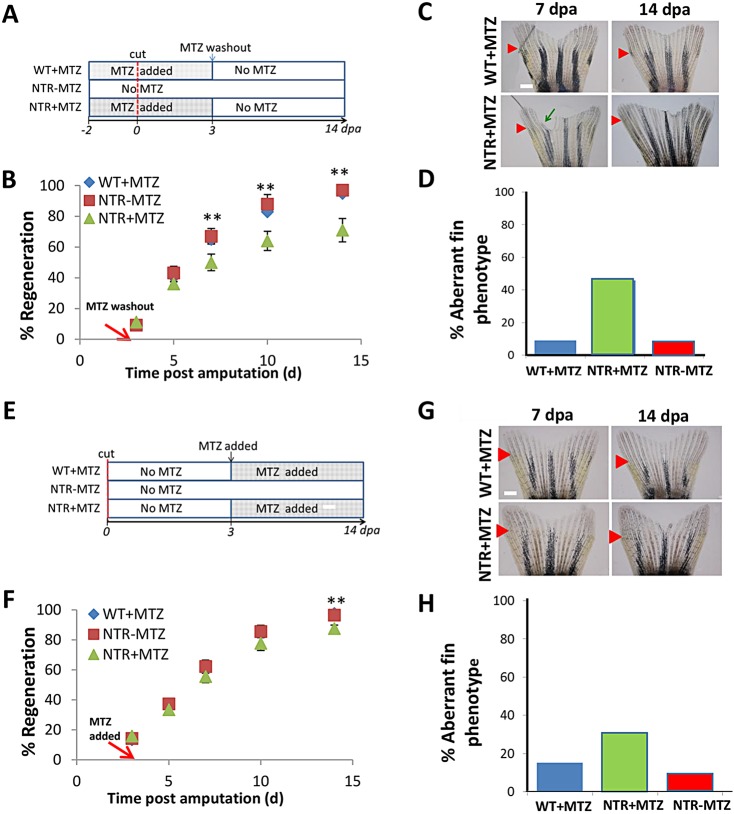
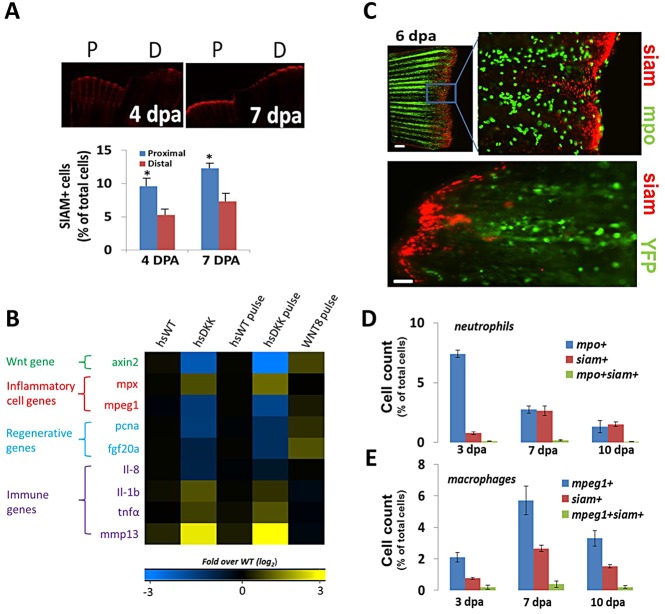
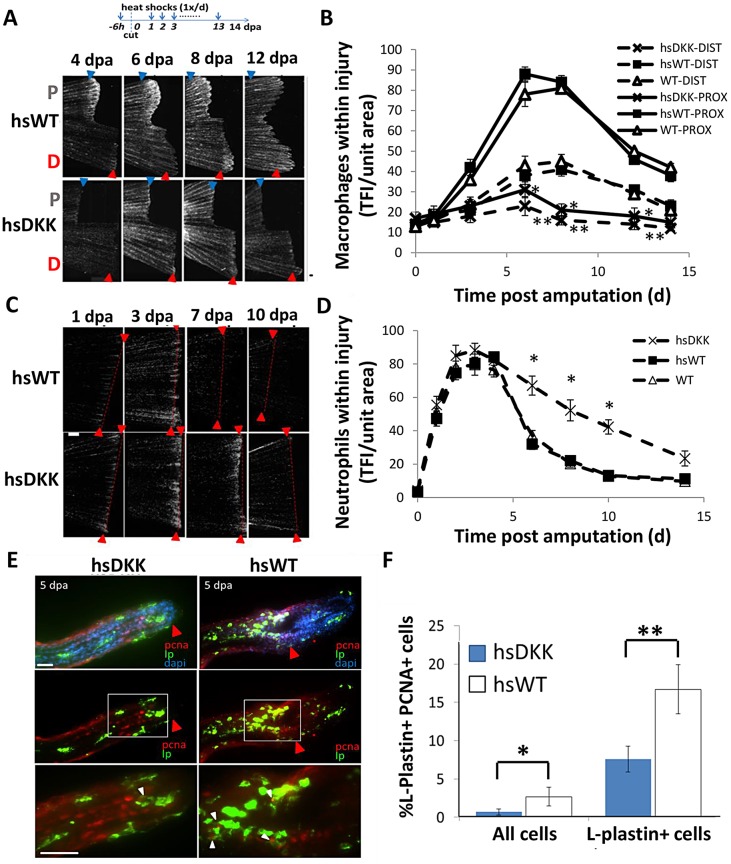
Neutrophils and macrophages, as key mediators of inflammation, have defined functionally important roles in mammalian tissue repair. Although recent evidence suggests that similar cells exist in zebrafish and also migrate to sites of injury in larvae, whether these cells are functionally important for wound healing or regeneration in adult zebrafish is unknown. To begin to address these questions, we first tracked neutrophils (lyzC(+), mpo(+)) and macrophages (mpeg1(+)) in adult zebrafish following amputation of the tail fin, and detailed a migratory timecourse that revealed conserved elements of the inflammatory cell response with mammals. Next, we used transgenic zebrafish in which we could selectively ablate macrophages, which allowed us to investigate whether macrophages were required for tail fin regeneration. We identified stage-dependent functional roles of macrophages in mediating fin tissue outgrowth and bony ray patterning, in part through modulating levels of blastema proliferation. Moreover, we also sought to detail molecular regulators of inflammation in adult zebrafish and identified Wnt/β-catenin as a signaling pathway that regulates the injury microenvironment, inflammatory cell migration and macrophage phenotype. These results provide a cellular and molecular link between components of the inflammation response and regeneration in adult zebrafish.

Keywords: Fin; Inflammation; Macrophages; Neutrophils; Regeneration; Wnt; Zebrafish.


Figures

Fig. 1.
Fig. 1.
Leukocyte recruitment in regenerating caudal fins follows distinct timelines and aligns with positional memory. (A,B) Representative images detailing a regenerative timecourse of neutrophil accumulation in Tg(mpo:GFP) amputated fish, from uncut through 14 dpa. Fish received a dorsal proximal cut (indicated by ‘P’) and a ventral distal cut (‘D’). Fluorescent images were acquired and converted to grayscale for visualization. (C) Neutrophil density was quantified separately for the resected edge of both the proximal and distal cuts (n=9). Total fluorescence intensity of GFP-positive cells was normalized to the injured fin area and used as a correlation for cell number (see Materials and Methods). TFI, total fluorescence intensity. (D,E) Using the same strategy as above, macrophages were tracked in Tg(mpeg1:mCherry) fish during 14 days of regeneration. Boxes indicate regions magnified. (F) Quantification of macrophages near the amputation planes for proximal and distal cuts (n=10). Both neutrophils and macrophages accumulate in greater numbers in more proximal (faster regenerating) compared with distally cut tissue. Error bars indicate s.e.m. averages of each experiment. Scale bars: 200 µm.
Fig. 2.
Fig. 2.
Macrophages modulate caudal fin regeneration rate and phenotype. (A) Macrophages were continuously ablated after fin resection (up to 14 dpa) using the macrophage ablation fish line Tg(mpeg1:NTR-eYFP). Fin images are representative of macrophage-ablated (NTR+MTZ) and control (WT+MTZ) fish in at least three independent experiments. Green arrows point to areas of unusually reduced tissue growth and formation; red arrowheads indicate the original fin cut line. (B) Quantification of regenerated tissue as a percentage of original fin area for NTR+MTZ (n=11), WT+MTZ (n=18) and control fish (NTR−MTZ, n=14). Full regeneration to the original fin area is considered 100% regeneration. Data are compiled and averaged over three separate experiments using identical conditions. 10 dpa, *P=0.0124; 14 dpa, *P=0.0262; two-tailed t-test. Error bars indicate s.e.m. averages of each experiment. (C) Representative images at 4 dpa and 10 dpa of MTZ-treated Tg(mpeg1:NTR-eYFP) caudal fins displaying aberrant tissue phenotypes. (D) Summary of percentage of fish qualitatively assessed for aberrant phenotypes at 14 dpa. Scale bars: 300 µm.
Fig. 3.
Fig. 3.
Macrophages modulate bony ray patterning and formation during tissue outgrowth. Macrophages were continuously ablated up to 10 dpa. (A) Representative fin images of NTR+MTZ (ii) versus control (i) for at least two independent experiments. Red bars indicate bifurcation points on each ray. Black arrowheads indicate the original fin cut line. (B) Total bifurcations in regenerated tissue are decreased in NTR+MTZ fish compared with wild-type fish. *P=0.030 (two-tailed t-test, error bars indicate s.e. m.). (C) The average number of total segments in each regenerated bony ray is decreased in NTR+MTZ fish compared with WT+MTZ fish. *P=0.040 (two-tailed t-test, error bars indicate s.e.m.). (D) Average segment width for NTR+MTZ and control fins. No significant differences were observed. (E) Fluorescent images of calcein staining in (ii) WT+MTZ and (i) NTR+MTZ fish. Note the less intense and more scattered staining in NTR+MTZ fins compared with WT+MTZ fins. (F) Mean calcein intensity is decreased in NTR+MTZ fish compared with WT+MTZ fish. *P=0.044 (two-tailed t-test, error bars indicate s.e.m.). (G) Coefficient of variation (C.O.V.; a measure of dispersion) for calcein intensity is significantly increased in NTR+MTZ fish compared with wild-type fish. *P=0.047 (two-tailed t-test, three separate experiments, error bars indicate s.e.m.).
Fig. 4.
Fig. 4.
Macrophages modulate the proliferative capacity of the regeneration blastema. (A) Hematoxylin-stained sections of tail fin regenerates (blastemal region) at 3 dpa. Macrophage-depleted fins (right) display slightly reduced numbers of deep mesenchymal cells of the blastema. Arrowheads indicate the plane of amputation. (B) Blastemal and macrophage proliferation assessed by staining 2 (iii,iv) or 3 (i,ii) dpa regenerates for PCNA (i-iv) or L-plastin (i,ii), a marker for leukocytes (mostly macrophages), and with DAPI. Scale bars: 20 µm. (C) Quantification of the length of the blastema in macrophage-depleted (NTR+MTZ; n=7) and wild-type (n=6) fins at 3 dpa. Macrophage-depleted fins displayed slightly decreased blastemal size compared with wild-type fins. (D) Cell proliferation (PCNA+ cells) quantified in the blastema is reduced in NTR+MTZ compared with wild-type controls. PCNA+ cell number was averaged among all sections spanning the entire fin width, and normalized to DAPI counts in the image. WT+MTZ, n=10; NTR−MTZ, n=8; NTR+MTZ, n=9. *P=0.0425 (two-tailed t-test, error bars indicate s.e.m.).
Fig. 5.
Fig. 5.
Macrophages exhibit stage-dependent effects on fin regeneration. (A) Experimental scheme. Macrophages were ablated after fin resection through 3 dpa, then allowed to repopulate normally via MTZ washout. (B) Representative fin images at 7 and 14 dpa, which is 4 and 11 days after macrophage repopulation initiation, respectively. Green arrow indicates irregular fin phenotype, as dictated by non-homogenous growth areas; red arrows indicate original resection plane. (C) Macrophage reduction through 3 dpa largely recapitulated the reduction in regenerative outgrowth seen with 14 days ablation. Rate of tissue regeneration was reduced in NTR+MTZ (n=11) fish compared with WT+MTZ (n=7) and NTR-MTZ (n=10) fish. Data are averaged over two separate experiments using identical conditions. 7 dpa, **P=0.0455; 10 dpa, **P=0.0278; 14 dpa, **P=0.0220; two-tailed t-test. (D) Quantification of percentage of fish displaying any aberrant phenotype at 14 dpa. Total quantification is cumulative from two separate experiments. (E) Experimental scheme. Macrophages were ablated beginning at 3 dpa through 14 dpa. (F) Representative images at 7 and 14 dpa, which is 4 and 11 days after the ablation of macrophages had begun, respectively. (G) Delayed macrophage reduction did not significantly reduce the rate of regeneration. Data are averaged over two separate experiments using the same conditions. (H) Quantification of the percentage of fish displaying any aberrant phenotype at 14 dpa. Data are cumulative from two separate experiments. Error bars indicate s.e.m. Scale bars: 300 µm.
Fig. 6.
Fig. 6.
Wnt/β-catenin signaling by non-leukocytes affects the injury environment in regenerating fins. (A) Representative images detailing cells undergoing Wnt/β-catenin signaling (siam+, red) for proximal and distal fin resections in Tg(TCFsiam:mCherry) fish. Siam+ cell number is increased in proximal cuts. 4 dpa, *P=0.0329; 7 dpa, *P=0.0296 (two-tailed t-test, error bars indicate s.e.m.). (B) Gene expression levels (4 dpa) of pooled blastemal fin tissue (n>5) as assessed by qRT-PCR for wild-type and for the Tg(hsDKK1:GFP) loss-of-function and Wnt8a (hsWnt8a:GFP) gain-of-function Wnt/β-catenin signaling fish lines. Levels were normalized to fold over non-heat shock control. Data were averaged over two separate experiments. One group included daily heat shock following amputation; the other group included a single heat shock pulse at 84 hpa with tissue extraction 12 h later at 4 dpa. mpx is mpo. (C) Representative images of distal resections from Tg(mpo:GFP; TCFsiam:mCherry) fish and Tg(mpeg1:NTR-YFP; TCFsiam:mCherry) fish at 6 dpa. Little colocalization is evident between neutrophils (mpo+) and siam+ cells. Scale bar: 40 µm; 100 µm in bottom panel. (D) Quantification of flow cytometry sorted cells from pooled resected fins (n=8) from Tg(mpo:GFP; TCFsiam:mCherry) fish indicating the presence of few mpo+ siam+ cells. (E) Quantification of flow cytometry sorted cells from pooled resected fins (n=7) from Tg(mpeg1:NTR-eYFP; TCFsiam:mCherry) fish indicating the presence of few mpeg1+ siam+ cells. (D,E) Error bars indicate s.e.m. of the average of three experiments.
Fig. 7.
Fig. 7.
Wnt/β-catenin signaling regulates leukocyte response to injury. (A) The loss-of-function Wnt/β-catenin signaling line Tg(hsDKK1:GFP) crossed to the Tg(mpeg1:mCherry) line was used to track macrophages after Wnt modulation. Resected wild-type or loss-of-function Wnt/β-catenin signaling (hsDKK) fins received a proximal cut and a distal cut. Representative images are shown of macrophage accumulation through 12 dpa. Fluorescent images were acquired and converted to grayscale for ease of visualization. (B) Macrophage accumulation was reduced in DKK1-overexpressing fins at every time point from 3 dpa until 14 dpa and no significant difference in macrophage number was observed between proximal and distal resections. Data are representative of at least three independent experiments with at least six to eight fish per time point. HsDKK-PROX versus hsWT-PROX, WT-PROX: 6 dpa, *P=0.0083; 8 dpa, *P=0.0072; 12 dpa, P=0.0175. HsDKK-DIST versus WT-DIST, WT-DIST; 6 dpa, **P=0.0140; 8 dpa, **P=0.0195; 12 dpa, **P=0.0361; two-tailed t-test. (C) Tg(hsDKK1:GFP) was crossed to a neutrophil promoter-driven Tg(lyzC:dsRed) line in order to visualize neutrophil accumulation following Wnt inhibition. Representative images indicate that neutrophil accumulation remains elevated longer in DKK1-overexpressing fins compared with wild-type controls. (D) Neutrophil accumulation was higher in DKK1-overexpressing fins compared with wild-type controls after 5 dpa. Data are representative of three independent experiments with at least six to eight fish per time point/condition. hsDKK1 versus hsWT, WT: 6 dpa, *P=0.0075; 8 dpa, *P=0.0112; 10 dpa, *P=0.0105; two-tailed t-test. (E) Proliferation of wild-type and DKK1-overexpressing regenerates at 5 dpa as assessed by anti-PCNA (red), anti-L-plastin (green) and DAPI (blue) staining. Red arrowheads indicate original cut site; white arrowheads indicate double-stained (PCNA+ LP+) cells. The boxed regions are magnified beneath. (F) Proliferating macrophages as a percentage of total cells and total macrophages (LP+ cells). Numbers were averaged over at least seven sections of each sample. Data are representative of three independent experiments (n>5). hsDKK1 versus hsWT: *P=0.0475; **P=0.0349 (two-tailed t-test, error bars indicate s.e.m.). Scale bars: 200 µm in A; 300 µm in C; 20 µm in E.

References

    1. Baker-LePain J. C., Nakamura M. C., Lane N. E. (2011). Effects of inflammation on bone: an update. Curr. Opin. Rheumatol. 23, 389-395 10.1097/BOR.0b013e3283474dbe - DOI - PubMed
    1. Brancato S. K., Albina J. E. (2011). Wound macrophages as key regulators of repair: origin, phenotype, and function. Am. J. Pathol. 178, 19-25 10.1016/j.ajpath.2010.08.003 - DOI - PMC - PubMed
    1. Cailhier J. F., Sawatzky D. A., Kipari T., Houlberg K., Walbaum D., Watson S., Lang R. A., Clay S., Kluth D., Savill J., et al. (2006). Resident pleural macrophages are key orchestrators of neutrophil recruitment in pleural inflammation. Am. J. Respir. Crit. Care Med. 173, 540-547 10.1164/rccm.200504-538OC - DOI - PMC - PubMed
    1. Chen C.-F., Chu C.-Y., Chen T.-H., Lee S.-J., Shen C.-N., Hsiao C.-D. (2011). Establishment of a transgenic zebrafish line for superficial skin ablation and functional validation of apoptosis modulators in vivo. PLoS ONE 6, e20654 10.1371/journal.pone.0020654 - DOI - PMC - PubMed
    1. Colucci-Guyon E., Tinevez J.-Y., Renshaw S. A., Herbomel P. (2011). Strategies of professional phagocytes in vivo: unlike macrophages, neutrophils engulf only surface-associated microbes. J. Cell Sci. 124, 3053-3059 10.1242/jcs.082792 - DOI - PubMed

Publication types