. 2014 Jul;141(13):2621-32.
doi: 10.1242/dev.106237.

Gene expression profiling identifies the zinc-finger protein Charlatan as a regulator of intestinal stem cells in Drosophila

Affiliations

Gene expression profiling identifies the zinc-finger protein Charlatan as a regulator of intestinal stem cells in Drosophila

Alla Amcheslavsky et al. Development. 2014 Jul.

Abstract

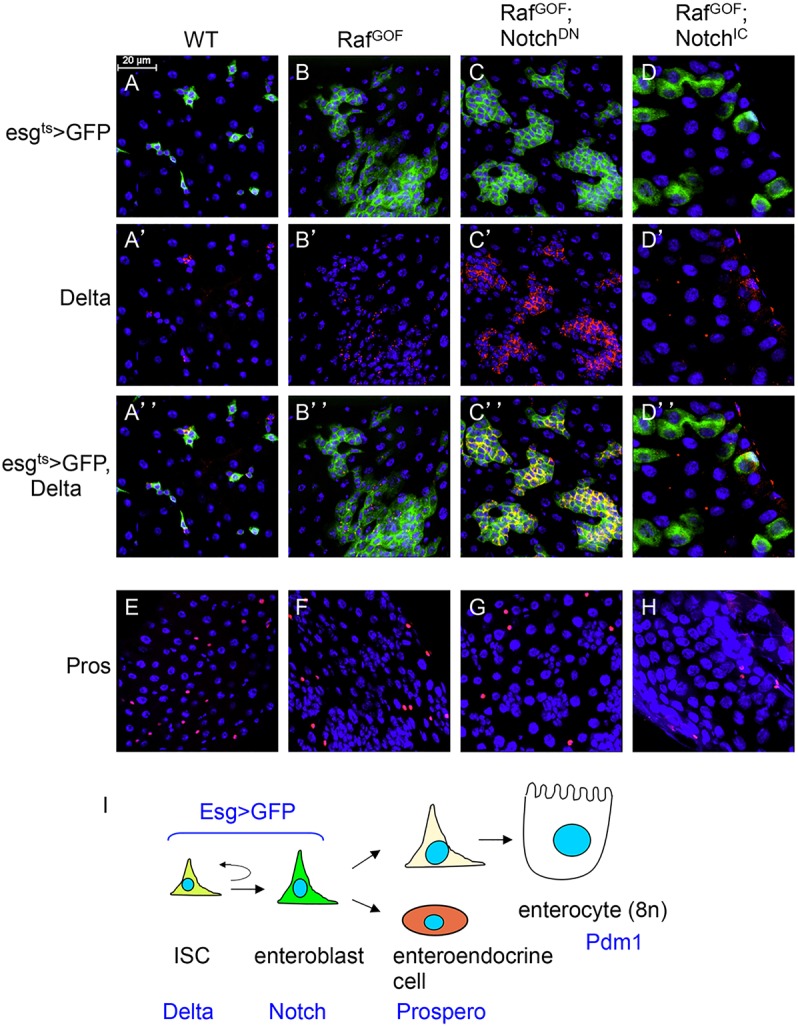
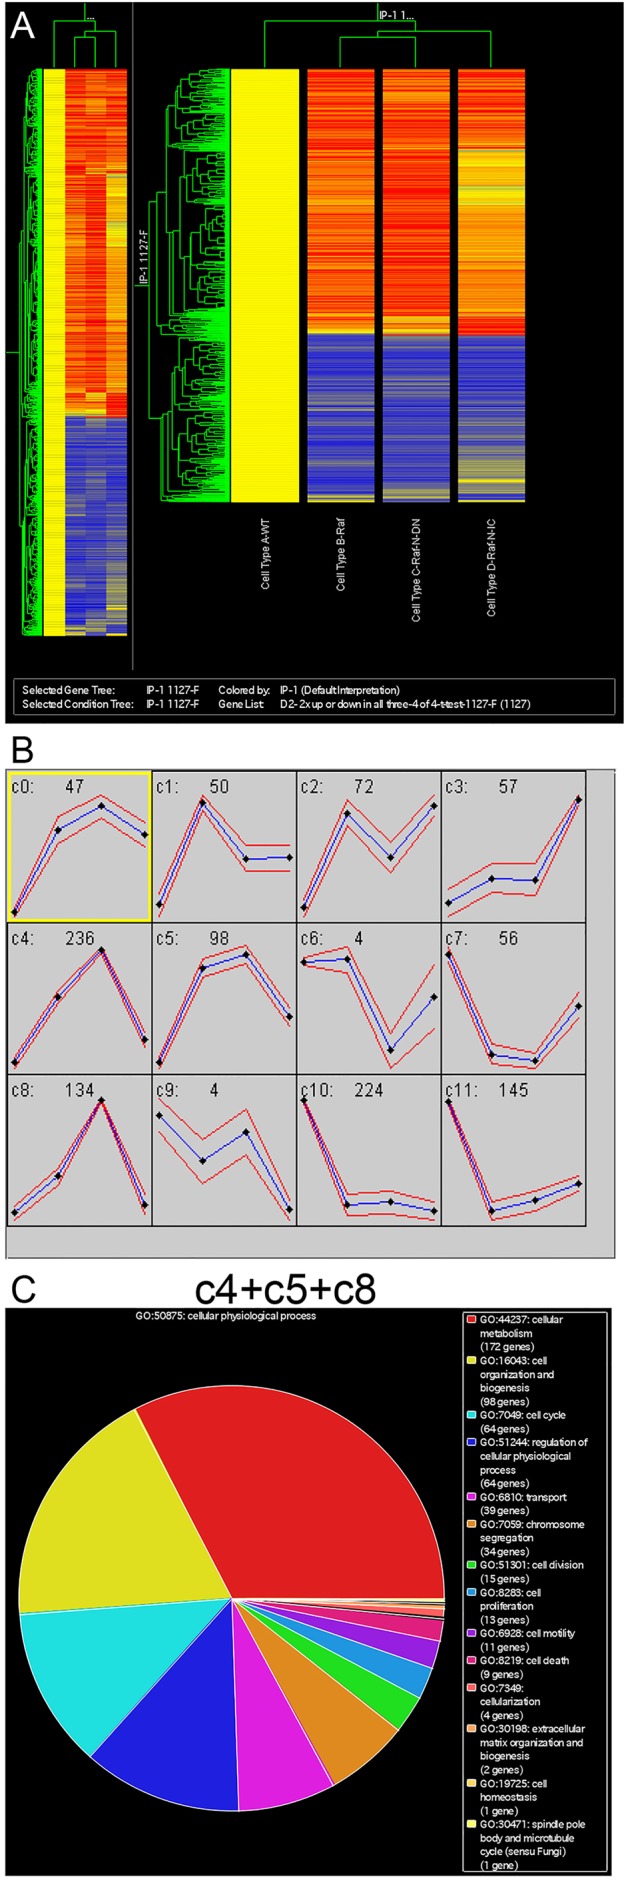
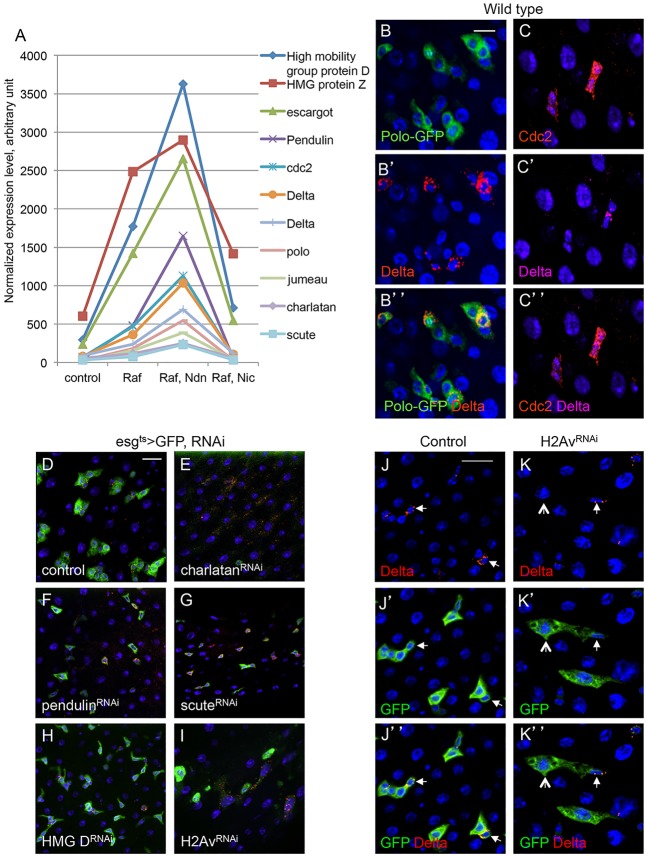
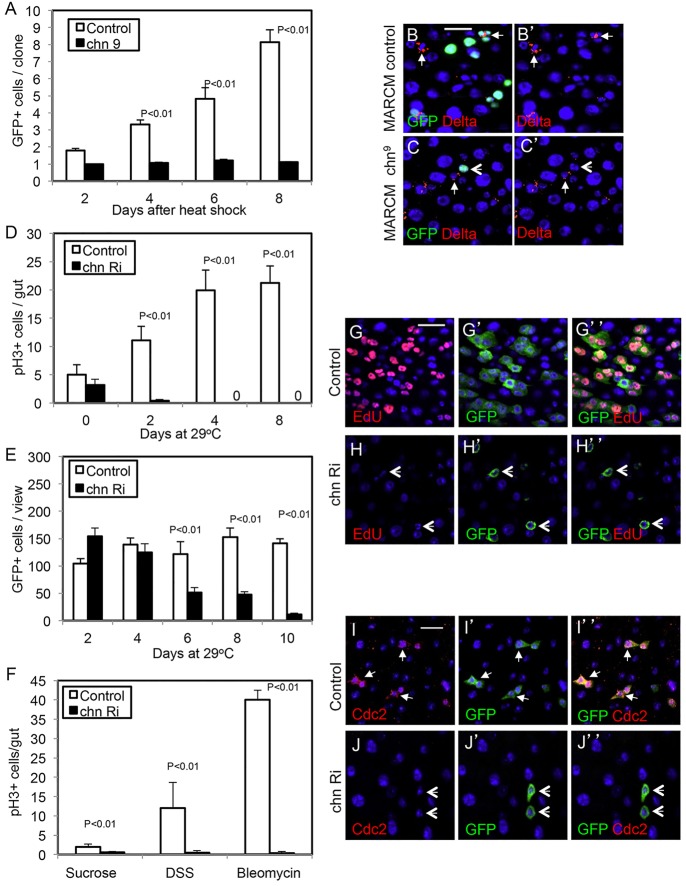
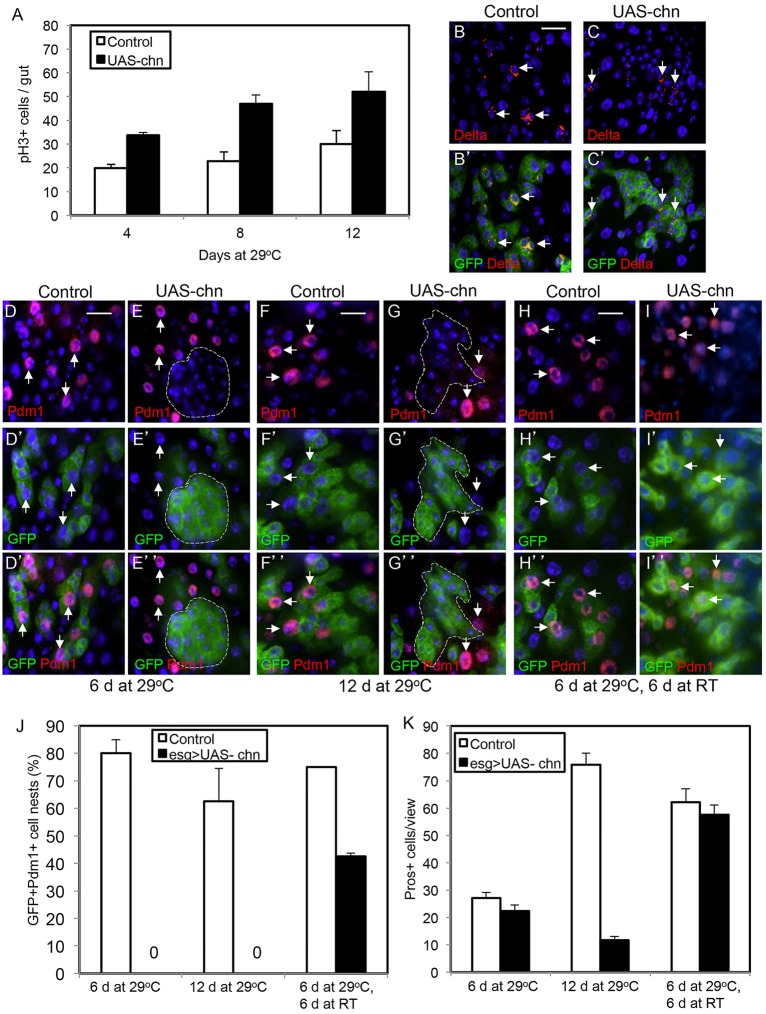
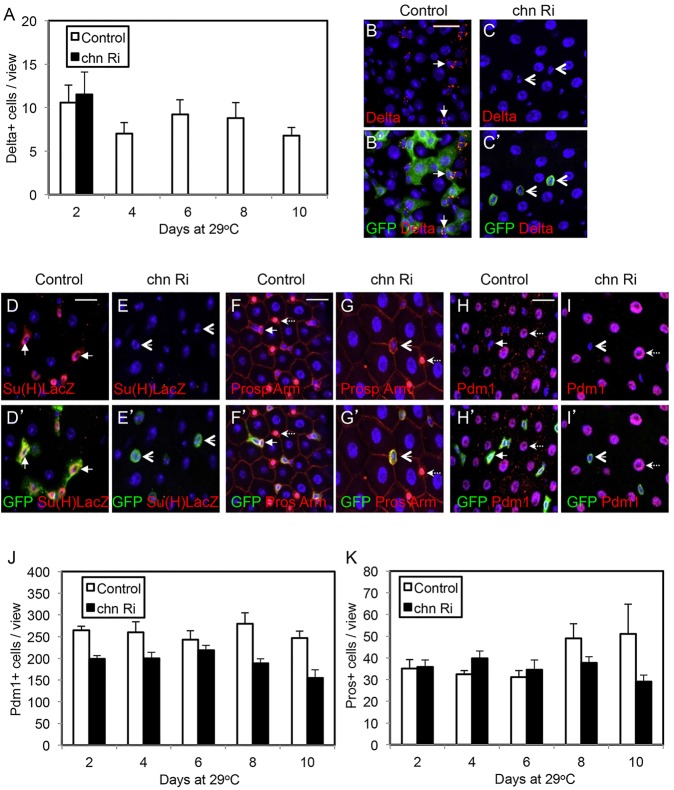
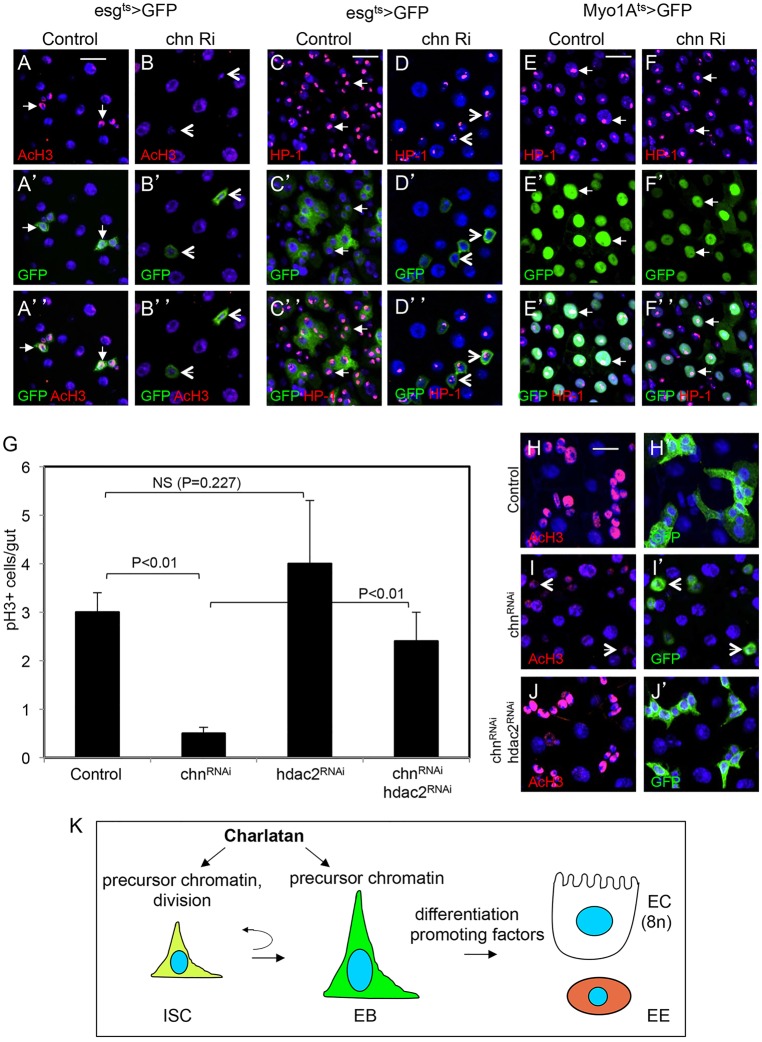
Intestinal stem cells (ISCs) in the adult Drosophila midgut can respond to tissue damage and support repair. We used genetic manipulation to increase the number of ISC-like cells in the adult midgut and performed gene expression profiling to identify potential ISC regulators. A detailed analysis of one of these potential regulators, the zinc-finger protein Charlatan, was carried out. MARCM clonal analysis and RNAi in precursor cells showed that loss of Chn function caused severe ISC division defects, including loss of EdU incorporation, phosphorylated histone 3 staining and expression of the mitotic protein Cdc2. Loss of Charlatan also led to a much reduced histone acetylation staining in precursor cells. Both the histone acetylation and ISC division defects could be rescued by the simultaneous decrease of the Histone Deacetylase 2. The overexpression of Charlatan blocked differentiation reversibly, but loss of Charlatan did not lead to automatic differentiation. The results together suggest that Charlatan does not simply act as an anti-differentiation factor but instead functions to maintain a chromatin structure that is compatible with stem cell properties, including proliferation.

Keywords: Charlatan; Chromatin; Drosophila; Intestine; Stem cells; Zinc-finger protein.


Figures

Fig. 1.
Fig. 1.
Genetic conversion of precursors into stem-like cells. (A-H) The driver line genotype is esg-Gal4, UAS-GFP; tubulinGal80ts (esgts>GFP). This driver was crossed with w– as wild-type (WT) control. The other genotypes include UAS-RafGOF located on the X chromosome, together with UAS-NotchDN or UAS-NotchIC. The progenies of the crosses were kept at 18°C. After hatching for 5 days, the flies of the correct genotype combinations were transferred to 29°C for 36 h, which would inactivate the Gal80ts repressor and allow Gal4 to function and initiate UAS-driven expression. The guts were then dissected and subjected to immunofluorescent staining with antibodies for Delta or Prospero. The red is Delta staining, which is mostly punctate and cytoplasmic (A′-D′). The red nuclear staining is Prospero (E-H). Blue staining is DAPI for nuclear DNA; green is GFP. Scale bar in A for A-H: 20 μm. (I) The cell types and markers in the adult midgut. ISC, intestinal stem cell; EB, enteroblast; EE, enteroendocrine cell; EC, enterocyte. Delta, Su(H)LacZ (Notch pathway target gene), Prospero and Pdm1 are markers for the respective cell types. The esg>GFP is expressed in both ISC and EB.
Fig. 2.
Fig. 2.
Identification of transcripts that are differentially expressed in the midguts with varying number of ISC-like cells. (A) RNA isolated from adult midguts of the genotypes described in Fig. 1 were used for microarray analysis. 1127 genes showed significant increases or decreases in expression when compared with the wild type. These 1127 genes were analyzed by using a hierarchical clustering algorithm (GeneSpring) in two dimensions, according to gene and experiment vectors. In this analysis, the intensity signal of each transcript in the Raf, Raf+NotchDN and Raf+NotchIC backgrounds was normalized to that in the wild-type background. The resulting expression ratios from four independent replicates were averaged, transformed to base two logarithms and clustered using the standard correlation coefficient as a distance metric. Genes were plotted along the vertical axis, with the gene cluster on the left. Experimental samples are plotted along the horizontal axis, with the experiment cluster tree at the top of the plot. Color coding is used to represent the fold-change in expression. Red indicates transcripts with increased expression levels in the experimental condition relative to the wild-type sample; blue indicates transcripts with reduced expression levels. (B) Self-organizing map (SOM) analysis of the 1127 genes. The intensity signal of each transcript in the experimental sample was normalized to that in the wild-type sample. The resulting expression ratios from four independent replicates were averaged, normalized by standardizing each row (gene) to mean=0 and variance=1. Transcripts were then grouped into 12 clusters (a 3×4 SOM). For each cluster, the y-axis represents the relative expression levels and the horizontal axis represents different experimental conditions in the order (from left to right): 1, wild type; 2, Raf; 3, Raf+NotchDN; 4, Raf+NotchIC. In each cluster, the mean expression level is represented as a blue line and standard deviation is the red line. (C) Gene Ontology analysis of the transcripts from clusters c4, c5 and c8 of SOM in B. The transcripts are classified into different categories based on their involvement in different physiological processes.
Fig. 3.
Fig. 3.
Expression and function of representative genes associated with ISCs or precursors. (A) The plot shows normalized expression of selected genes from SOM clusters c4, c5 and c8, in which the well-known ISC/precursor cell markers Delta and escargot are included. Average values from the four microarray experiments are shown. Genes in this set have diverse molecular functions. (B-C″) Expression analysis of the cell-cycle regulators Polo and Cdc2 in wild-type midguts. The Polo-GFP is a FlyTrap line in which the GFP-coding sequence is fused with the endogenous Polo-coding sequence. The expression was detected by anti-GFP immunofluorescence staining. The Polo-GFP was detected in Delta+ cells and neighboring EBs. Cdc2 antibody staining for the endogenous protein was similarly present in both Delta+ ISCs and adjacent EBs. (D-I) Functional analysis by RNAi of potential ISC regulators. Transgenic RNAi flies for chn, pendulin, scute, HMG D and H2Av were crossed with esgts>GFP. Control was a cross with w– flies. Adult flies ∼5 days old were placed at 29°C for 3 days more and the midguts were dissected for imaging. (J-K″) H2Av RNAi midguts stained for Delta expression showing that ISCs still had Delta expression (arrows), but GFP+ cell nests had lower cell numbers and the neighboring EB appeared to be larger in size (arrowheads in K).
Fig. 4.
Fig. 4.
Chn is required cell-autonomously for ISC division. (A-C′) Wild-type and chn mutant MARCM clones were generated after 37°C heat shock of the flies to induce FLP expression and mitotic recombination. The flies were returned to 29°C for the number of days indicated and midguts were dissected for analysis. (A) The average number of GFP+ cells per clone in chn9 mutant clones (black bars) is significantly lower than in wild-type clones (white bars) at various time points. Data are mean±s.e.m. (B,B′) A 4-day-old wild-type clone; Delta staining indicates ISCs (arrows). (C,C′) A 4-day-old chn mutant clone, which shows no detectable Delta staining (arrowheads). (D) The control flies were esgts>GFP crossed with w– flies, and the chn Ri were esgts>GFP crossed with UAS-chnRNAi flies. The strong reduction in mitotic activity in chn RNAi fly midguts becomes apparent as early as 2 days after shifting to 29°C. Data are mean±s.e.m. (E) Similar experiments were carried out and GFP+ cells were counted from microscopic images taken from posterior midguts with a 40× objective. (F) The control and chn RNAi flies were fed in 5% sucrose, or supplemented with 3% DSS or 25 μg/ml bleomycin. After 3 days of feeding, the guts were dissected and stained for pH3. (G-H′) The control and chn RNAi flies were incubated in 29°C for a total of 8 days. EdU was added to a 5% sucrose solution for feeding the flies for the last 24 h. Guts were dissected and used for EdU detection using the Click-iT detection kit. Approximately 90% of GFP+ cells in control guts also contained EdU signal. No EdU signal was detected in GFP+ cells of chn RNAi midguts (arrowheads in H-H″). (I-J″) Similar experiments were performed and the guts were stained for the mitotic regulator Cdc2. The staining was absent from the GFP+ cells after chn RNAi (arrowheads in J-J″).
Fig. 5.
Fig. 5.
High level of Chn antagonizes differentiation reversibly. (A-C) The control flies were esgts>GFP crossed with w–flies, and the UAS-chn were esgts>GFP crossed with a fly strain containing a UAS-chn transgene. Midguts were dissected from the flies after incubation at 29°C for the indicated time. Staining for pH3 was performed and the number of positive cells is shown in A. Data are mean±s.e.m. The Delta staining in both control and UAS-chn guts after the flies were incubated at 29°C for 4 days are shown in B and C (some examples of Delta+ cells are indicated by arrows). (D-I″) The control and UAS-chn flies were incubated at 29°C for 6 (D-E″) or 12 (F-G″) days. The downshift experiments were carried out by incubating at 29°C for 6 days and at room temperature (∼23°C) for 6 days (H-I″). The guts were dissected and stained for the EC differentiation marker Pdm1. The arrows indicate examples of Pdm1+ nuclear staining. The encircled clusters of GFP+ cells in the UAS-chn samples contain no detectable Pdm1 staining. In the downshift experiments, many of the GFP+ cells became Pdm1+. (J) Quantification of GFP+ cells clusters that also contained at least 1 Pdm1+ cell, also expressed as a percentage of all GFP+ cells clusters. UAS-chn expression after incubation at 29°C suppressed all the expression of Pdm1 in GFP+ cells, and the differentiation marker could be detected again when the Chn expression was stopped at room temperature for 6 days. Data are mean±s.e.m. (K) The same experiments were performed and stained for the EE marker Prospero. The Prospero+ cells do not overlap with the esg>GFP+ cells. Graph shows that the number of Prospero+ cells after 29°C incubation is similar in control and UAS-chn guts because they were already present before temperature shift. Incubation for 12 days allowed more EEs to accumulate in control guts, but the accumulation was inhibited when Chn was overexpressed. The downshift experiment showed that the differentiation of EE resumed when Chn overexpression was stopped after 6 days. Data are mean±s.e.m.
Fig. 6.
Fig. 6.
Loss of Chn does not cause precocious differentiation. The control flies were esgts>GFP crossed with w– flies, and the chn Ri were esgts>GFP crossed with UAS-chnRNAi flies. (A) The hatched flies were transferred to 29°C for the days as indicated and guts were dissected and stained for Delta. The number of Delta+ cells is significantly reduced after induction of chn RNAi (black bars) compared with control midguts (white bars). No Delta+ cells in chn RNAi samples were detected after day 4. Data are mean±s.e.m. The samples in B-C′ are from flies incubated at 29°C for 6 days. The arrows indicate examples of Delta+ staining and arrowheads indicate GFP+ cells with no Delta staining after chn RNAi. (D-E′) Similar experiments after an 8-day incubation at 29°C. The size of the GFP+ cells in RNAi midguts remained small but no expression of the EB reporter Su(H)LacZ was detected (arrowheads). (F-G′) The esg>GFP+ cells (arrows) and the nuclear Prospero staining (dashed arrows) normally do not overlap in control guts. After chn RNAi, the GFP+ cells were still separate from Prospero+ cells (arrows versus dashed arrows). (H-I′) Similarly, the esg>GFP+ cell nests (arrows) did not express Pdm1, which was detectable in differentiated ECs (dashed arrows). After chn RNAi, the GFP+ cells still did not express Pdm1 (arrowheads). (J,K) Quantification of differentiated cells in control and chn RNAi guts. Images under a 40× objective were taken from the posterior midguts of control and RNAi flies. Graph shows the average numbers of Pdm1+ ECs and Prospero+ EEs at different time points after incubation of the flies at 29°C. Data are mean±s.e.m.
Fig. 7.
Fig. 7.
Chn regulates the chromatin of precursor cells. (A-D) The control flies were esgts>GFP crossed with w– flies, and the chn Ri were esgts>GFP crossed with UAS-chnRNAi flies. Five-day-old flies were transferred to 29°C for 4 days and the midguts analyzed by staining for acetylated histone 3 (AcH3) (A-B″) and Heterochromatin Protein 1 (HP1) (C-D″). Arrows indicate normal cells with positive staining and arrowheads indicate chn RNAi cells with no AcH3 staining or with abnormal HP-1 staining. (E-F″) Myo1Ats>GFP crossed with w– was the control, in which the HP-1 staining was detected in all cells, including enterocytes (arrows). When this enterocyte driver was crossed with chn RNAi, the HP-1 staining appeared to be similar to control samples (arrows). Flies were incubated for 8 days at 29°C before dissection and staining. (G) Quantification of the number of mitotic cells in the midgut with the indicated RNAi constructs driven by the esgts>GFP. The progenies of the crossed flies were allowed to hatch and age for 5 days and were then shifted to 29°C for 4 days before dissection and staining for pH3. NS is not significant, with P>0.05. Data are mean±s.e.m. (H-J′) Representative confocal images of midguts from the indicated RNAi experiments after staining for AcH3. Arrowheads in I,I′ indicate examples of GFP+ RNAi cells with no AcH3 staining. The staining reappeared in J when hdac2 was also knocked down. (K) A model for stem cell maintenance by Chn. Chn is required to maintain a chromatin structure compatible with being precursor cells. Loss of Chn, however, does not cause automatic differentiation, indicating that loss of stemness and initiation of differentiation can be a multi-step process.

Similar articles

Cited by

References

    1. Agarwal N., Hardt T., Brero A., Nowak D., Rothbauer U., Becker A., Leonhardt H., Cardoso M. C. (2007). MeCP2 interacts with HP1 and modulates its heterochromatin association during myogenic differentiation. Nucleic Acids Res. 35, 5402-5408 10.1093/nar/gkm599 - DOI - PMC - PubMed
    1. Amcheslavsky A., Jiang J., Ip Y. T. (2009). Tissue damage-induced intestinal stem cell division in Drosophila. Cell Stem Cell 4, 49-61 10.1016/j.stem.2008.10.016 - DOI - PMC - PubMed
    1. Amcheslavsky A., Ito N., Jiang J., Ip Y. T. (2011). Tuberous sclerosis complex and Myc coordinate the growth and division of Drosophila intestinal stem cells. J. Cell Biol. 193, 695-710 10.1083/jcb.201103018 - DOI - PMC - PubMed
    1. Bardin A. J., Perdigoto C. N., Southall T. D., Brand A. H., Schweisguth F. (2010). Transcriptional control of stem cell maintenance in the Drosophila intestine. Development 137, 705-714 10.1242/dev.039404 - DOI - PMC - PubMed
    1. Biteau B., Jasper H. (2011). EGF signaling regulates the proliferation of intestinal stem cells in Drosophila. Development 138, 1045-1055 10.1242/dev.056671 - DOI - PMC - PubMed

Publication types