Convergence of ubiquitylation and phosphorylation signaling in rapamycin-treated yeast cells
- PMID: 24961812
- PMCID: PMC4125731
- DOI: 10.1074/mcp.O113.035683
Convergence of ubiquitylation and phosphorylation signaling in rapamycin-treated yeast cells
Abstract
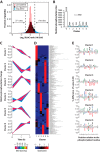
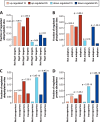
The target of rapamycin (TOR) kinase senses the availability of nutrients and coordinates cellular growth and proliferation with nutrient abundance. Inhibition of TOR mimics nutrient starvation and leads to the reorganization of many cellular processes, including autophagy, protein translation, and vesicle trafficking. TOR regulates cellular physiology by modulating phosphorylation and ubiquitylation signaling networks; however, the global scope of such regulation is not fully known. Here, we used a mass-spectrometry-based proteomics approach for the parallel quantification of ubiquitylation, phosphorylation, and proteome changes in rapamycin-treated yeast cells. Our data constitute a detailed proteomic analysis of rapamycin-treated yeast with 3590 proteins, 8961 phosphorylation sites, and 2299 di-Gly modified lysines (putative ubiquitylation sites) quantified. The phosphoproteome was extensively modulated by rapamycin treatment, with more than 900 up-regulated sites one hour after rapamycin treatment. Dynamically regulated phosphoproteins were involved in diverse cellular processes, prominently including transcription, membrane organization, vesicle-mediated transport, and autophagy. Several hundred ubiquitylation sites were increased after rapamycin treatment, and about half as many decreased in abundance. We found that proteome, phosphorylation, and ubiquitylation changes converged on the Rsp5-ubiquitin ligase, Rsp5 adaptor proteins, and Rsp5 targets. Putative Rsp5 targets were biased for increased ubiquitylation, suggesting activation of Rsp5 by rapamycin. Rsp5 adaptor proteins, which recruit target proteins for Rsp5-dependent ubiquitylation, were biased for increased phosphorylation. Furthermore, we found that permeases and transporters, which are often ubiquitylated by Rsp5, were biased for reduced ubiquitylation and reduced protein abundance. The convergence of multiple proteome-level changes on the Rsp5 system indicates a key role of this pathway in the response to rapamycin treatment. Collectively, these data reveal new insights into the global proteome dynamics in response to rapamycin treatment and provide a first detailed view of the co-regulation of phosphorylation- and ubiquitylation-dependent signaling networks by this compound.
© 2014 by The American Society for Biochemistry and Molecular Biology, Inc.
Figures


Similar articles
-
Yeast α-arrestin Art2 is the key regulator of ubiquitylation-dependent endocytosis of plasma membrane vitamin B1 transporters.PLoS Biol. 2019 Oct 28;17(10):e3000512. doi: 10.1371/journal.pbio.3000512. eCollection 2019 Oct. PLoS Biol. 2019. PMID: 31658248 Free PMC article.
-
Stress conditions promote yeast Gap1 permease ubiquitylation and down-regulation via the arrestin-like Bul and Aly proteins.J Biol Chem. 2014 Aug 8;289(32):22103-16. doi: 10.1074/jbc.M114.582320. Epub 2014 Jun 18. J Biol Chem. 2014. PMID: 24942738 Free PMC article.
-
Phosphorylation of a conserved Thr357 in yeast Nedd4-like ubiquitin ligase Rsp5 is involved in down-regulation of the general amino acid permease Gap1.Genes Cells. 2013 Jun;18(6):459-75. doi: 10.1111/gtc.12049. Epub 2013 Mar 20. Genes Cells. 2013. PMID: 23517290
-
Role of Rsp5 ubiquitin ligase in biogenesis of rRNA, mRNA and tRNA in yeast.RNA Biol. 2015;12(12):1265-74. doi: 10.1080/15476286.2015.1094604. RNA Biol. 2015. PMID: 26403176 Free PMC article. Review.
-
The role of Rsp5 ubiquitin ligase in regulation of diverse processes in yeast cells.Acta Biochim Pol. 2008;55(4):649-62. Epub 2008 Nov 28. Acta Biochim Pol. 2008. PMID: 19039336 Review.
Cited by
-
Maximizing Depth of PTM Coverage: Generating Robust MS Datasets for Computational Prediction Modeling.Methods Mol Biol. 2022;2499:1-41. doi: 10.1007/978-1-0716-2317-6_1. Methods Mol Biol. 2022. PMID: 35696073 Review.
-
SEA you later alli-GATOR--a dynamic regulator of the TORC1 stress response pathway.J Cell Sci. 2015 Jun 15;128(12):2219-28. doi: 10.1242/jcs.168922. Epub 2015 May 1. J Cell Sci. 2015. PMID: 25934700 Free PMC article. Review.
-
Ready, SET, Go: Post-translational regulation of the histone lysine methylation network in budding yeast.J Biol Chem. 2021 Aug;297(2):100939. doi: 10.1016/j.jbc.2021.100939. Epub 2021 Jul 3. J Biol Chem. 2021. PMID: 34224729 Free PMC article. Review.
-
Genetic dissection of early endosomal recycling highlights a TORC1-independent role for Rag GTPases.J Cell Biol. 2017 Oct 2;216(10):3275-3290. doi: 10.1083/jcb.201702177. Epub 2017 Aug 2. J Cell Biol. 2017. PMID: 28768685 Free PMC article.
-
Dissecting Ubiquitylation and DNA Damage Response Pathways in the Yeast Saccharomyces cerevisiae Using a Proteome-Wide Approach.Mol Cell Proteomics. 2024 Jan;23(1):100695. doi: 10.1016/j.mcpro.2023.100695. Epub 2023 Dec 14. Mol Cell Proteomics. 2024. PMID: 38101750 Free PMC article.
References
-
- Wei Y., Zheng X. F. (2011) Nutritional control of cell growth via TOR signaling in budding yeast. Methods Mol. Biol. 759, 307–319 - PubMed
-
- Dazert E., Hall M. N. (2011) mTOR signaling in disease. Curr. Opin. Cell Biol. 23, 744–755 - PubMed
-
- Kaeberlein M., Powers R. W., 3rd, Steffen K. K., Westman E. A., Hu D., Dang N., Kerr E. O., Kirkland K. T., Fields S., Kennedy B. K. (2005) Regulation of yeast replicative life span by TOR and Sch9 in response to nutrients. Science 310, 1193–1196 - PubMed
Publication types
MeSH terms
Substances
LinkOut - more resources
Full Text Sources
Other Literature Sources
Molecular Biology Databases

