. 2015 Feb;29(2):474-82.
doi: 10.1038/leu.2014.202. Epub 2014 Jun 25.

CSNK1α1 mediates malignant plasma cell survival

Affiliations

CSNK1α1 mediates malignant plasma cell survival

Y Hu et al. Leukemia. 2015 Feb.

Abstract

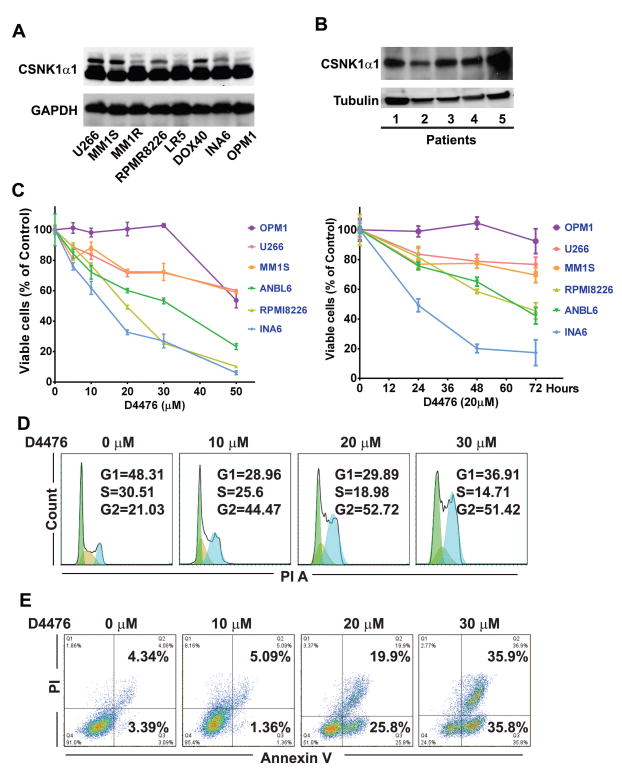
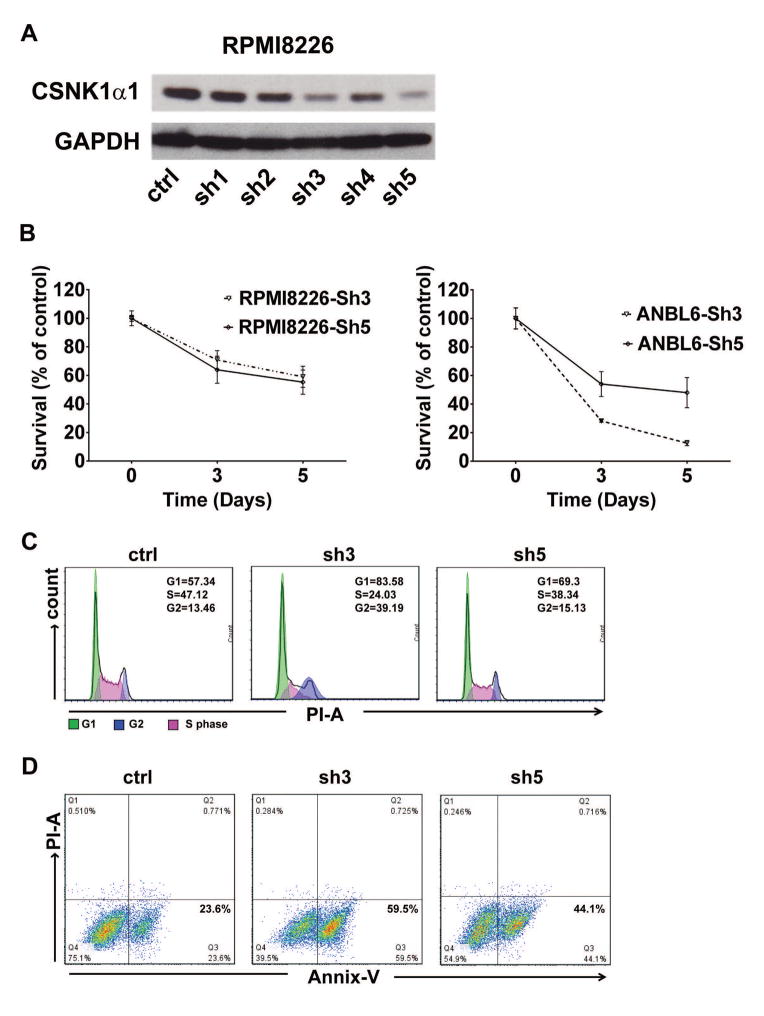
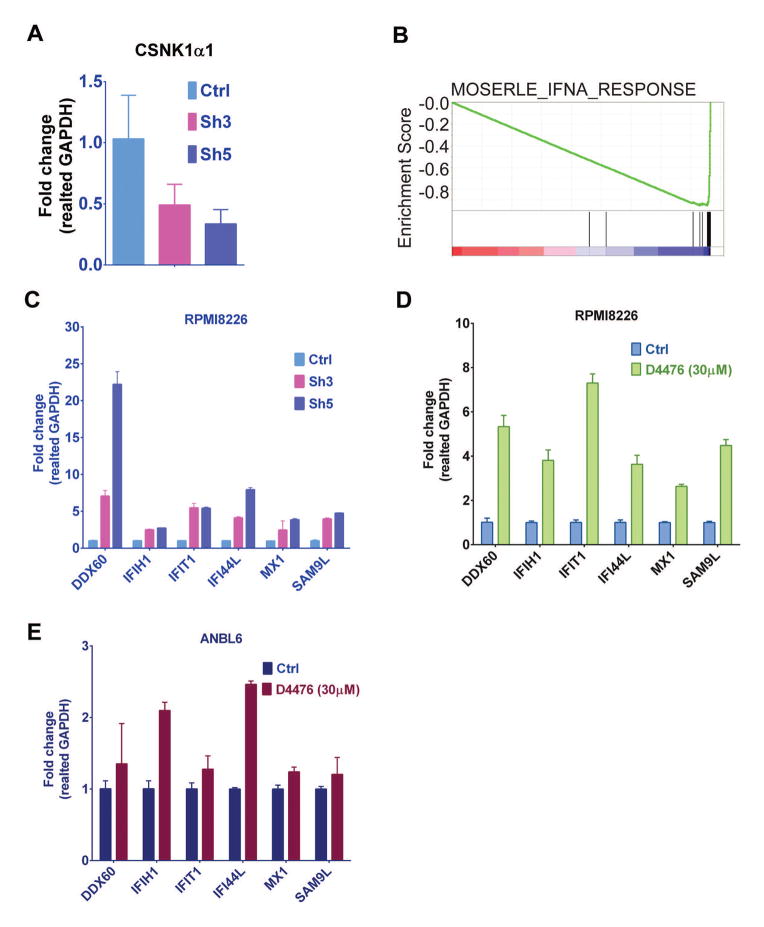
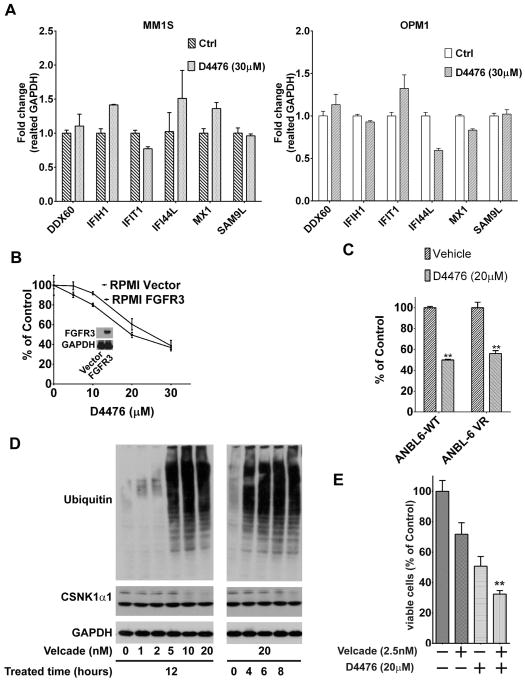
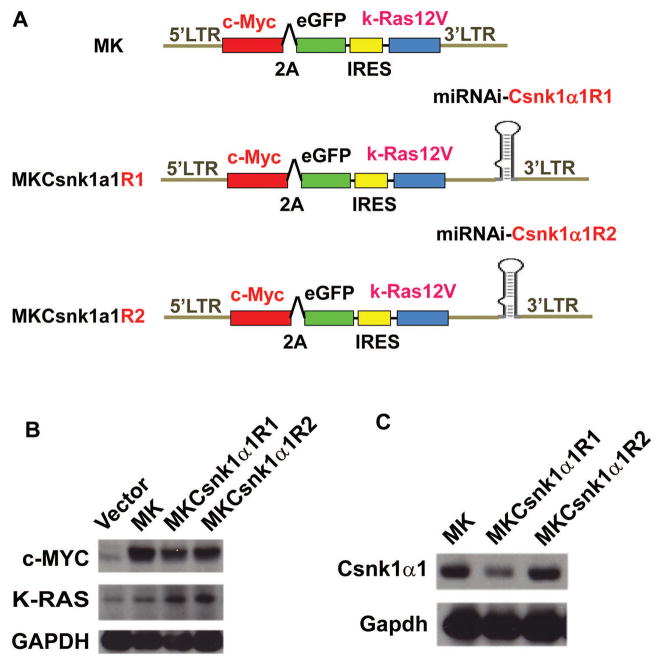
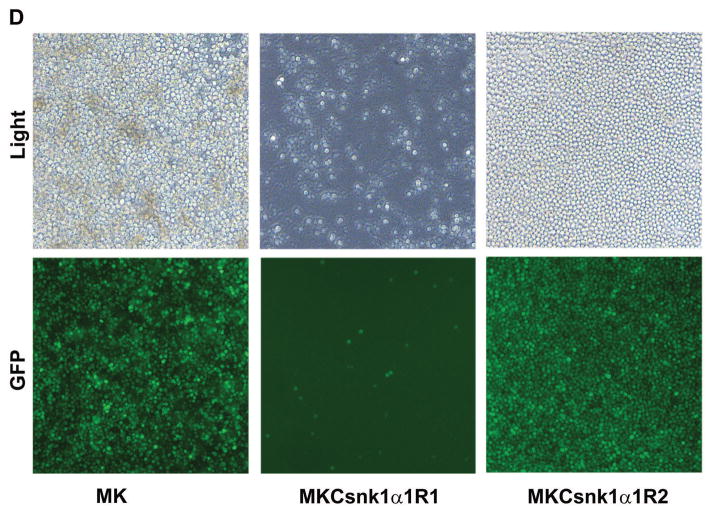
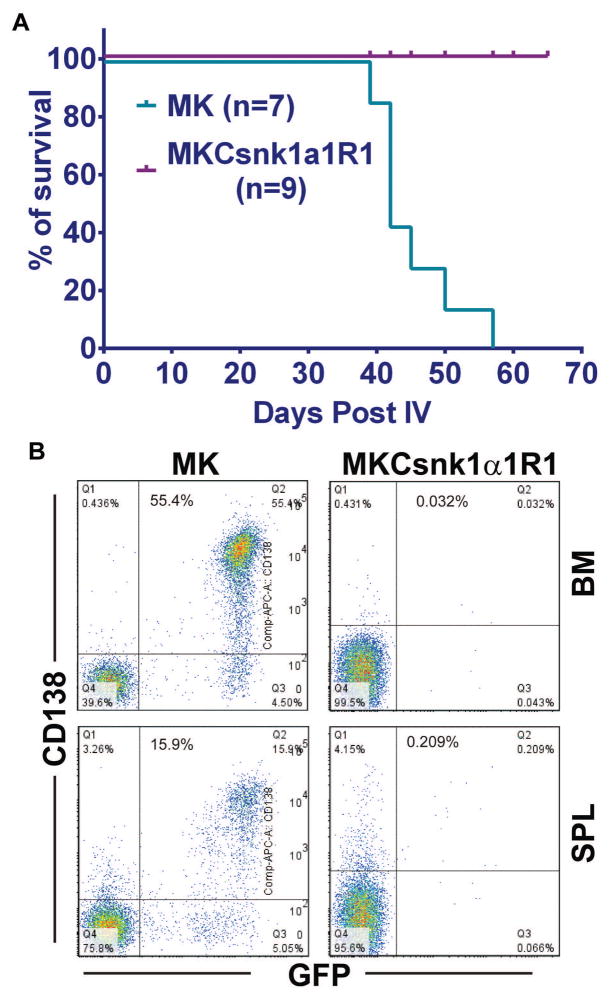
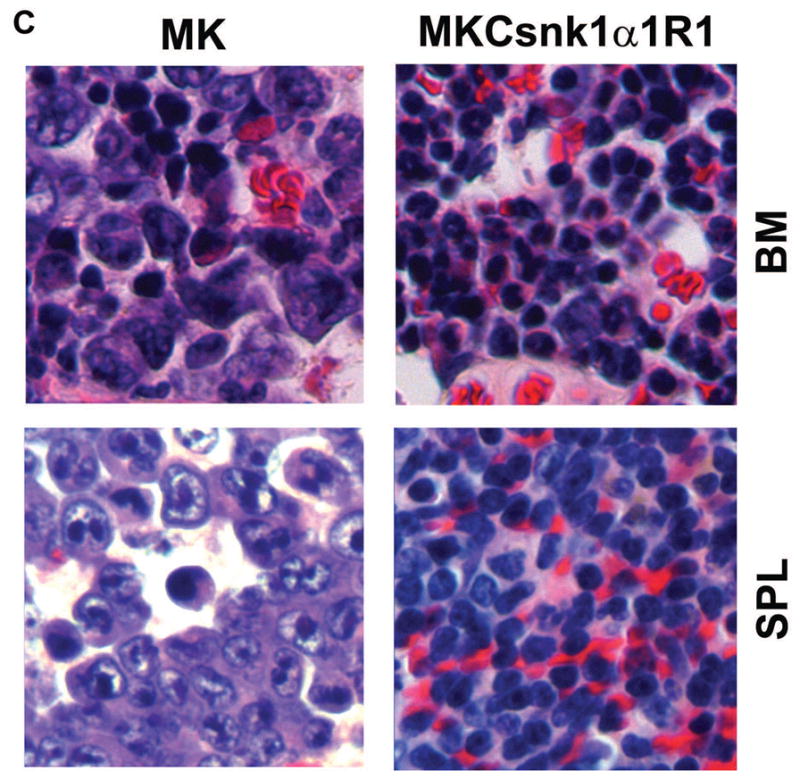
Here we report that targeting casein kinase 1-α1 (CSNK1α1) is a potential novel treatment strategy in multiple myeloma (MM) therapy distinct from proteasome inhibition. CSNK1α1 is expressed in all the tested MM cell lines and patient MM cells, and is not altered during bortezomib-triggered cytotoxicity. Inhibition of CSNK1α1 kinase activity in MM cells with targeted therapy D4476 or small hairpin RNAs triggers cell G0/G1-phase arrest, prolonged G2/M phase and apoptosis. D4476 also induced cytotoxicity in bortezomib-resistant MM cells and enhanced bortezomib-triggered cytotoxicity. CSNK1α1 signaling pathways include CDKN1B, P53 and FADD; gene signatures involved included interferon-α, tumor necrosis factor-α and LIN9. In addition, reduction of Csnk1α1 prevents cMYC/KRAS12V transformation of BaF3 cells independent of interleukin-3. Impartially, reducing Csnk1α1 prevented development of cMYC/KRAS12V-induced plasmacytomas in mice, suggesting that CSNK1α1 may be involved in MM initiation and progression. Our data suggest that targeting CSNK1α1, alone or combined with bortezomib, is a potential novel therapeutic strategy in MM. Moreover, inhibition of CSNK1α1 may prevent the progression of monoclonal gammopathy of undetermined significance to MM.


Conflict of interest statement

Conflict-of-interest disclosure: The authors have no conflicting financial interests.

Figures

Fig. 1
Fig. 1. CSNK1α1 is not involved in bortezomib-triggered cytotoxicity
(A), (B) Immunoblotting analysis shows that CSNK1α1 is expressed in MM (MM lines, n=8; MM patient cells, n=5). (C) MM1S cells were treated with bortezomib at the concentrations indicated for 12h (left) or with 20nM bortezomib for time internal, as indicated (right). Whole cells lysates were analyzed with immunoblotting against ubiquitin, CSNK1α1, and GAPDH. GAPDH or Tubulin served as loading controls.
Fig. 2
Fig. 2. D4476-induced cytotoxicity in MM lines
(A) Six MM lines were treated with D4476 (0–50μM) for 72h, or with 20μM D4476 for 0–72h. Viable cells were measured with MTT. (B) D4476 induced MM cell apoptosis. Annexin/PI staining and FACS analysis for apoptosis were performed on RPMI8226 cells treated with D4476 (0–30μM) for 72h. Viable cells are represented in Q4 (lower left). Increasing percentages of apoptosis cells are represented in Q2 (upper right) and Q3 (Lower right). (C) D4476 affected cell cycle progression. Cell cycle was examined with Flow Cytometry in RPMI8226 cells stained with PI and exposed to D4476 (0–30 μM) for 72h.
Fig. 3
Fig. 3. Reduction of CSNK1α1 protein decrease MM cell survival and inhibit cell cycle progression
RPMI8226 cells were transduced with control vector or CSNK1α1 shRNAs as indicated. (A) CSNK1α1 was examined with immunoblotting of whole-cell lysates of Ctrl or shRNAs-transfected RPMI8226 cells. GAPDH served as a loading control. (B) Viability was assayed with MTT. Data represent triplicate cultures. (C) Cells were harvested at 72h post viral transduction and stained with PI. Cell cycle was analyzed with Flow Cytometry. (D) Annexin/PI staining and FACS analysis for apoptosis were performed on RPMI8226 cells transduced with control vector, sh3 or 5. Viable cells are represented in Q4 (lower left). Increasing percentages of apoptotic cells are represented in Q2 (upper right) and Q3 (Lower right).
Fig. 4
Fig. 4. Gene expression signatures in MM cells with inhibition of CSNK1α1 activity
(A) RT-PCR shows CSNK1α1 mRNA level changes in RPMI8226 cells transduced with sh3 or 5 relative to control cells (Ctrl). All data represent mean of triplicate experiments. (B) GSEA showed genes in IFNα signature were significantly upregulated and enriched in RPMI8226 cells transduced with shRNA3 and 5. (C) RT-PCR confirmed mRNA level changes of six selected genes in RPMI8226 cells relative to control cells (Ctrl). (D), (E) RT-PCR shows mRNA level changes of selected genes in RPMI82226 or ANBL6 cells exposed to D4476 (30μM for 24h) relative to mRNA level in DMSO only treated cells (Ctrl).
Fig. 5
Fig. 5. Targeting CSNK1α1 induced cytotoxicity in bortezomib-resistant multiple myeloma cells
(A) Expression of selected genes was tested with RT-PCR in MM1S (left) or OPM1 (right) cells exposed to D4476 (30μM for 24h). All data represent mean of triplicate experiments. (B) FGFR3 was ectopically expressed in RPMI8826 cells. Compared with control vector transfected cells, cells with high expression of FGFR3 remained sensitive to D4476. (C) RPMI8226 cells were treated for 72h with DMSO, bortezomib (2.5nM), D4476 (20μM), or bortezomib (2.5nM) and D4476 (20μM). (D) ANBL6-WT and ANBL6-VR5 cells were treated with D4476 (20μM for 72h). Cell viability was measured with MTT.
Fig. 6
Fig. 6. cMYC/KRAS12V cannot transform BaF3 cells independent of IL3 with low level of Csnk1α1
(A) Schematic diagram of MSCV-based retroviral vectors: MK, MKCsnk1α1R1 and MKCsnk1α1R2. (B) Immunoblotting analysis shows expression of cMYC and KRAS12V in 293T cells transfected with the MK and MKCsnk1α1Rs vectors. GAPDH served as a loading control. (C) Immunoblotting shows Csnk1α1 expression in BaF3 cells transfected with MK and MKCsnk1α1Rs vectors. GAPDH served as a loading control. (D) Photographs of BaF3 cells transduced with MK, MKCsnk1α1R1, or MKCsnk1α1R2 vectors. MKCsnk1α1R1 transfection cannot drive BaF3 cell growth independent of IL3 in vitro (middle).

Similar articles

Cited by

References

    1. Palumbo A, Anderson K. Multiple myeloma. The New England journal of medicine. 2011 Mar 17;364(11):1046–1060. - PubMed
    1. Anderson KC. New insights into therapeutic targets in myeloma. Hematology / the Education Program of the American Society of Hematology American Society of Hematology Education Program. 2011;2011:184–190. - PubMed
    1. Kane RC, Bross PF, Farrell AT, Pazdur R. Velcade: U.S. FDA approval for the treatment of multiple myeloma progressing on prior therapy. The oncologist. 2003;8(6):508–513. - PubMed
    1. Field-Smith A, Morgan GJ, Davies FE. Bortezomib (Velcadetrade mark) in the Treatment of Multiple Myeloma. Therapeutics and clinical risk management. 2006 Sep;2(3):271–279. - PMC - PubMed
    1. Kuehl WM, Bergsagel PL. Molecular pathogenesis of multiple myeloma and its premalignant precursor. The Journal of clinical investigation. 2012 Oct 1;122(10):3456–3463. - PMC - PubMed

Publication types

MeSH terms