Review
. 2014 Aug;15(8):536-48.
doi: 10.1038/nrn3747. Epub 2014 Jun 25.

The functional architecture of the ventral temporal cortex and its role in categorization

Affiliations
Review

The functional architecture of the ventral temporal cortex and its role in categorization

Kalanit Grill-Spector et al. Nat Rev Neurosci. 2014 Aug.

Abstract

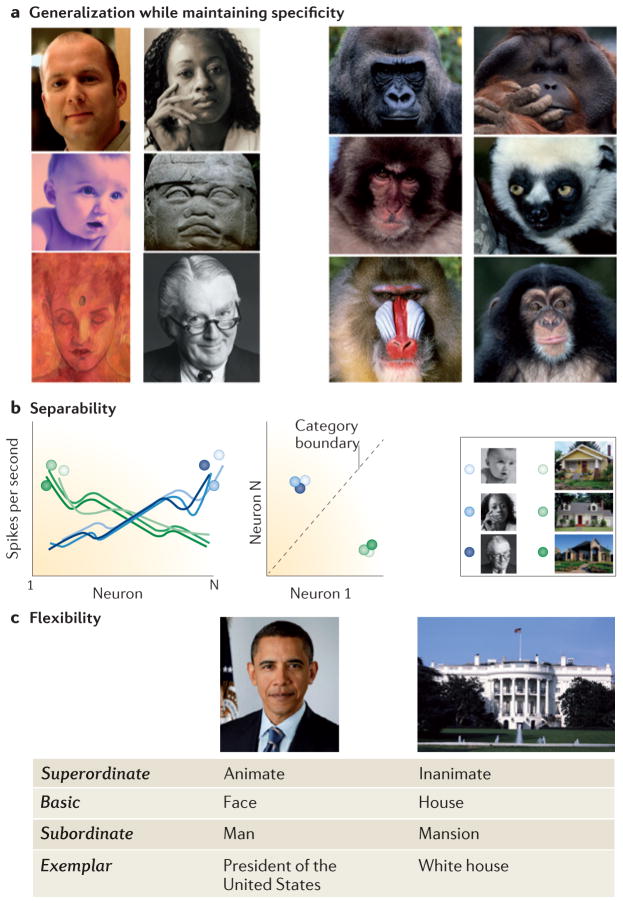
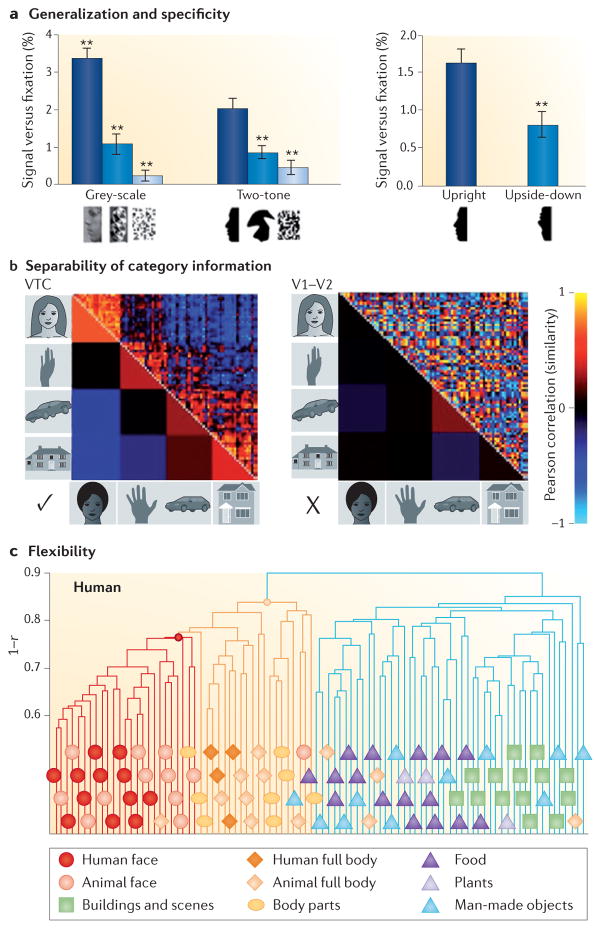
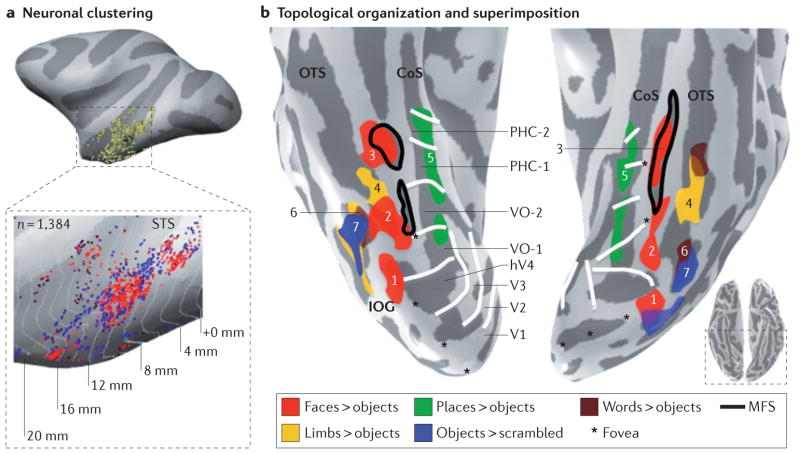
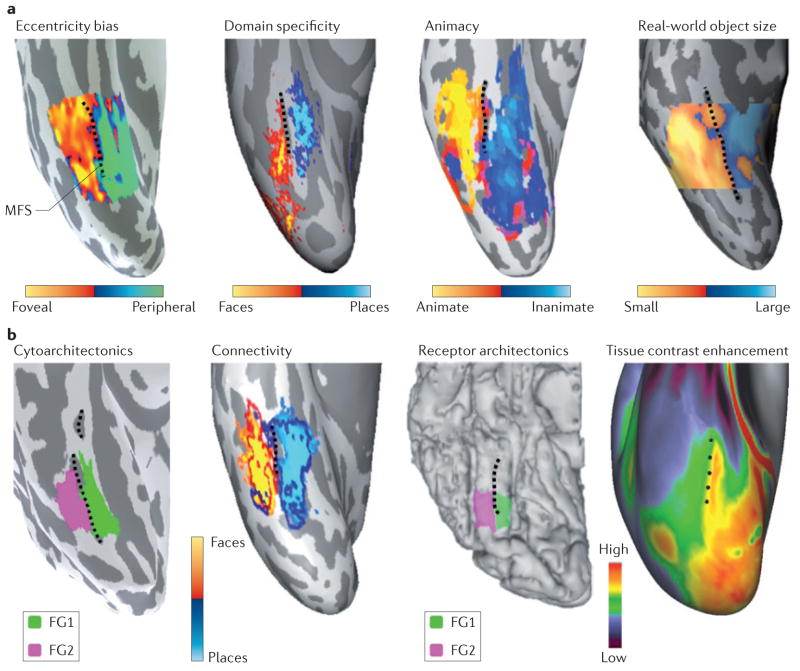
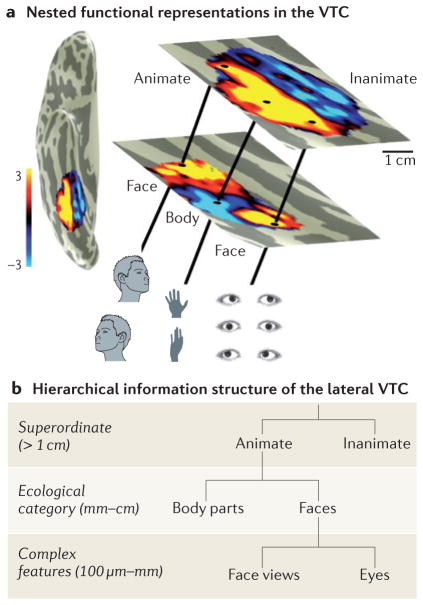
Visual categorization is thought to occur in the human ventral temporal cortex (VTC), but how this categorization is achieved is still largely unknown. In this Review, we consider the computations and representations that are necessary for categorization and examine how the microanatomical and macroanatomical layout of the VTC might optimize them to achieve rapid and flexible visual categorization. We propose that efficient categorization is achieved by organizing representations in a nested spatial hierarchy in the VTC. This spatial hierarchy serves as a neural infrastructure for the representational hierarchy of visual information in the VTC and thereby enables flexible access to category information at several levels of abstraction.


Conflict of interest statement

Competing interests statement

The authors declare no competing interests.

Figures

Figure 1
Figure 1. Computational goals of a visual categorization system
a | The recognition system should generalize across a range of category exemplars — as well as across format and image transformations — while distinguishing between categories with similar features and configurations (for example, between faces of different species). b | To achieve efficient categorization, category information should be easy to read out. One way to achieve this efficiently is to have representations that are linearly separable. Assuming that an exemplar is represented by the distributed responses across a population of neurons, the computational constraint of separability entails that two exemplars of a category will evoke more similar distributed responses across the neural population than two exemplars of different categories (left graph). If this constraint is met, a simple linear classifier can be used to categorize stimuli (right graph). c | The recognition system should be able to extract several levels of information from a given input, as required by the task demands; in other words, it should enable flexible access to category information at several levels of abstraction. All photos in parts a and b courtesy of Getty/PhotoDisc. Barack Obama photo courtesy of Pictorial Press Ltd/Alamy. White House photo courtesy of Getty/PhotoDisc.
Figure 2
Figure 2. Properties of the ventral temporal cortex representations
a | Generalization and specificity. Stronger functional MRI responses to faces are maintained across format (grey level and silhouettes) (left bar chart). Responses are higher for upright silhouettes than for upside-down silhouettes (right bar chart). **P < 0.001, significantly different from upright face silhouettes. Data from REF. . b | Separability of category information in the ventral temporal cortex (VTC) but not early visual cortex (V1–V2). Correlation matrices indicating the similarity between distributed responses to pairs of images from various categories (19 images per category) in the VTC and in V1–V2. In the top triangle, each cell shows the correlation between distributed responses to a pair of images. The bottom triangle shows the average correlation across images of a category. Hot colours indicate similar distributed response patterns and cold colours indicate dissimilar distributed response patterns. Data are from REF. and show electrocorticography measurements in an example subject. c | Flexibility. Hierarchical clustering of distributed VTC responses measured with functional MRI reveals a separation between superordinate categories (inanimate versus animate), between basic-level categories (faces versus bodies) and between subordinate categories (human faces versus animal faces). This demonstrates that multiple levels of category information are represented in the VTC. Part c is adapted with permission from REF. , Cell Press (Elsevier).
Figure 3
Figure 3. Three implementational features of the ventral temporal cortex: clustering, topological organization and superimposition
a | Neurons with similar category selectivity are clustered together. Each yellow dot indicates the location of a neuron that was recorded. In the enlarged version, red dots indicate individual face-selective neurons, and blue dots represent individual object-selective neurons in the macaque superior temporal sulcus (STS). b | Clustered functional regions responding to faces (red), places (green), words (brown), body parts (yellow) and objects (blue) have a consistent topology relative to macroanatomical landmarks in the human ventral temporal cortex (VTC). The mid-fusiform sulcus (MFS) predicts the location of the mid-fusiform face-selective region (mFus-faces (3); also known as FFA-2) and the posterior fusiform face-selective region (pFus-faces (2); also known as FFA-1). The inferior occipital gyrus (IOG) predicts the location of the IOG face-selective region (IOG-faces (1); also known as the occipital face area (OFA)). The occipitotemporal sulcus (OTS) predicts the location of both the occipitotemporal body part region (OTS-limbs (4); also known as the fusiform body area) and the visual word form area (VWFA (6)). The object-selective posterior fusiform/ occipitotemporal sulcus (pFus/OTS (7)) partially overlaps with the VWFA and extends more posteriorly. The collateral sulcus (CoS) predicts the location of parahippocampal place area (PPA (5); also known as the CoS place-selective region (CoS-places)). As a result of these structure–function correspondences, there is a consistent topological organization among functional activations. For example, place-selective regions are medial to face-selective regions, whereas OTS-limbs separates pFus-faces from mFus-faces. Notably, within a given macroanatomical neighbourhood in the VTC, multiple representations are superimposed. For example, place-selective representations and retinotopic representations are superimposed along the CoS. hV, human visual area; PHC, parahippocampal; VO, ventral occipital. Data are shown on the inflated right and left hemispheres of a representative subject. Data in part b from REFS ,. Part a is adapted with permission from REF. , Society for Neuroscience.
Figure 4
Figure 4. Linking anatomical features to large-scale functional maps in the ventral temporal cortex
a | The mid-fusiform sulcus (MFS) predicts transitions in many large-scale functional maps in the ventral temporal cortex (VTC). Lateral–medial functional transitions in the eccentricity bias map (based on data from REF. 17), the domain-specificity map (based on data from REF. 33), the animacy map (based on data from REF. 116) and the real-world object-size map (based on data from REF. and T. Konkle, personal communication) are all aligned to the MFS (shown by the dashed black line). Each panel shows a representative inflated right hemisphere from an individual subject, with the exception of the domain-specificity map, which was generated from ten subjects. b | The MFS predicts transitions of anatomical features of the VTC. Lateral–medial anatomical transitions in cytoarchitecture, in white-matter connectivity, in the density of muscarinic acetylcholine receptor type 3 and in tissue contrast enhancement (which is thought to be related to myelin content) are each aligned to the MFS. Each panel shows a representative right hemisphere, with the exception of the tissue contrast enhancement map, which is generated from 196 subjects from the Human Connectome Project (based on data from REFS 122,123). FG, fusiform gyrus. The cytoarchitecture panel is based on data from REF. . The connectivity panel is based on data from REF. and Z. M. Saygin, personal communication. The receptor architectonics panel is based on data from REF. . Receptor architectonics panel courtesy of J. Caspers, Institute of Neuroscience and Medicine (INM-1), Research Centre Jülich, Germany. Tissue contrast enhancement panel courtesy of M. F. Glasser and D. C. Van Essen, Washington University, St Louis, Missouri, USA.
Figure 5
Figure 5. The spatial structure of nested functional representations in the ventral temporal cortex supports the hierarchical information structure
a | Superimposition of functional representations in the ventral temporal cortex (VTC) from the animacy map (top) to clustered face-selective regions and body part-selective regions (middle) to clustering of neurons with shared response properties (bottom). b | Schematic hierarchy linking the spatial scale of functional representations implemented in the lateral VTC to the scale of information that each level represents. We propose that more-abstract information is represented at a larger spatial scale and more-concrete information at a finer spatial scale. We illustrate this idea with animate hierarchies as an example: superordinate information (animate) is represented at the scale of the entire VTC (several centimetres); information about ecological categories such as faces and body parts is represented at the centimetre scale; and exemplar information and complex-feature information is represented at the columnar level or an even smaller spatial scale. Additional hierarchies are likely to exist in the medial VTC and the VTC more generally.

Similar articles

Cited by

References

    1. Thorpe S, Fize D, Marlot C. Speed of processing in the human visual system. Nature. 1996;381:520–522. - PubMed
    1. Grill-Spector K, Kanwisher N. Visual recognition: as soon as you know it is there, you know what it is. Psychol Sci. 2005;16:152–160. - PubMed
    1. Ungerleider LG, Mishkin M. In: Analysis of Visual Behaviour. Ingle DJ, Goodale MA, Mansfield RJW, editors. MIT Press; 1982. pp. 549–586.
    1. Tong F, Nakayama K, Vaughan JT, Kanwisher N. Binocular rivalry and visual awareness in human extrastriate cortex. Neuron. 1998;21:753–759. - PubMed
    1. Grill-Spector K, Kushnir T, Hendler T, Malach R. The dynamics of object-selective activation correlate with recognition performance in humans. Nature Neurosci. 2000;3:837–843. - PubMed

Publication types