. 2014 Aug 15;289(33):23189-23199.
doi: 10.1074/jbc.M114.567107. Epub 2014 Jun 24.

SLC17A9 protein functions as a lysosomal ATP transporter and regulates cell viability

Affiliations

SLC17A9 protein functions as a lysosomal ATP transporter and regulates cell viability

Qi Cao et al. J Biol Chem. .

Abstract

Lysosomes contain abundant ATP, which is released through lysosomal exocytosis following exposure to various stimuli. However, the molecular mechanisms underlying lysosomal ATP accumulation remain unknown. The vesicular nucleotide transporter, also known as solute carrier family 17 member 9 (SLC17A9), has been shown to function in ATP transport across secretory vesicles/granules membrane in adrenal chromaffin cells, T cells, and pancreatic cells. Here, using mammalian cell lines, we report that SLC17A9 is highly enriched in lysosomes and functions as an ATP transporter in those organelles. SLC17A9 deficiency reduced lysosome ATP accumulation and compromised lysosome function, resulting in cell death. Our data suggest that SLC17A9 activity mediates lysosomal ATP accumulation and plays an important role in lysosomal physiology and cell viability.

Keywords: ATP; Cell Death; Lysosome; Transporter; Vacuolar ATPase; Vesicular Nucleotide Transporter.


Figures

FIGURE 1.
FIGURE 1.
ATP transport across lysosomal membrane is blocked by DIDS or Evans blue. A, ATP uptake in isolated lysosomes is blocked by DIDS or Evans blue but not by CBX or NFA. Lysosomes isolated from HEK293T cells were treated with CBX, NFA, DIDS, or Evans blue (20 μm) for 30 min and then subjected to ATP uptake assays. Lysosomes were suspended in sodium-free homogenizing buffer (0.25 m sucrose, 1 mm EDTA, 10 mm HEPES (pH 7.0)) which was used under the “buffer alone” condition to detect intrinsic decay of ATP luminescence after ATP addition. At 11 and 21 min, ATP was added to 100 μl of sample to a final concentration (Conc) of 2 μm. Decay of ATP luminescence was detected over time as an indicator of active ATP uptake. At the end of the assay, 0.1% Triton X-100 was added to measure total ATP released from vesicles. B, ATP levels at 19 and 29 min. DIDS or Evans blue blocked ATP transport into lysosomes and resulted in higher extralysosome ATP levels relative to controls, whereas CBX or NFA treatment had no significant effect. Data were obtained from three independent experiments. NT, no treatment. **, p < 0.01. C, luminescence decay was observed in intact lysosomes but not in GPN (200 μm)-treated lysosomes, which release lysosomal ATP, or in buffer alone.
FIGURE 2.
FIGURE 2.
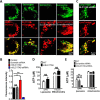
DIDS and Evans Blue inhibit ATP accumulation in lysosomes. A, COS1 cells were treated with inhibitors (CBX, 20 μm; NFA, 20 μm; DIDS, 20 μm; Evans blue, 20 μm) for 3 h at 37 °C, labeled with LysoTracker, and stained with quinacrine (10 μm). B, quinacrine fluorescence intensity of the images in A. Values were normalized to the fluorescence intensity of non-treated control cells. DIDS and Evans blue treatment dramatically decreased quinacrine intensity. The experiment was repeated three times. **, p < 0.01. C and D, DIDS and Evans blue, but not CBX and NFA, decreased lysosomal ATP accumulation. COS1 cells were treated with inhibitors at 20 μm for 3 h, and then cells were fractionated. Isolated lysosomal and mitochondrial fractions were collected and assayed for ATP content. Equal amount of samples on the basis of protein content (75 μg) were loaded per assay. GPN (200 μm) was used to lyse lysosomes. Data were obtained from three independent experiments. NT, no treatment; NS, no significance. **, p < 0.01.
FIGURE 3.
FIGURE 3.
SLC17A9 localizes to lysosomes. A, detection of endogenous SLC17A9 in lysosomal fractions in COS1 cell. Bands of the predicted size of SLC17A9 were detected in Lamp1-positive fractions but not complex II-positive fractions. B, detection of overexpressed mSLC17A9-GFP in COS1 cell lysosomal fractions. C, endogenous SLC17A9 is located in Lamp1-GFP-expressing vesicles. Cells were transiently transfected with Lamp1-GFP, and endogenous SLC17A9 was detected by fluorescent staining. Note that a large amount of SLC17A9 protein is localized in Lamp1-positive puncta. D, overexpressed SLC17A9 is located primarily in LysoTracker- or Lamp1-GFP-positive organelles. The experiment was repeated three times, and representative images are shown. E, orthographic projection and side view of z-stack images to show lysosomal localization of SLC17A9.
FIGURE 4.
FIGURE 4.
ATP is transported into lysosomes through SLC17A9. A, detection of mSLC17A9 in WT or mSLC17A9 knockdown C2C12 cells. Whole cell lysates were used, and GAPDH levels served as loading controls. B, detection of endogenous mSLC17A9 in isolated lysosomes of WT and mSLC17A9 knockdown C2C12 cells showing that endogenous protein levels are robustly down-regulated in the latter. C, SLC17A9 knockdown impairs lysosomal ATP uptake. Lysosomes of WT and mSLC17A9 knockdown C2C12 cells were isolated and assayed for ATP uptake. Conc, concentration. A and D, ATP levels at 21 and 43 min. The mSLC17A9-shRNA group showed significantly higher levels of ATP at 21 and 43 min, suggestive of impaired ATP transport. **, p < 0.01; NS, no significance. E and F, mSLC17A9-GFP overexpression facilitated ATP transport across lysosome membranes. 19 min after ATP addition, lysosomes from cells overexpressing mSLC17A9-GFP showed significant lower ATP levels than the WT group. DIDS (5 μm) significantly blocked ATP uptake in the WT group but not in the mSLC17A9-GFP-overexpressing group. DIDS (20 μm) blocked ATP uptake in both WT and mSLC17A9-GFP-overexpressing groups. *, p < 0.05; **, p < 0.01. G and H, CBX (20 μm) did not suppress ATP uptake mediated by mSLC17A9-GFP. The experiment was repeated three times in triplicate. *, p < 0.05.
FIGURE 5.
FIGURE 5.
SLC17A9 mediates lysosomal ATP accumulation. A and B, mSLC17A9 overexpression increases lysosomal ATP accumulation, whereas mSLC17A9 knockdown has the opposite effect. Lysosomal ATP levels were monitored using quinacrine (10 μm) staining. Lamp1-mCherry served as a lysosome marker. Values were normalized to non-treated control cells. The experiment was repeated three times, and representative images are shown. *, p < 0.05; **, p < 0.01; NS, no significance. C, SLC17A9 knockdown has no effect on LysoTracker staining. D, mSLC17A9-GFP overexpression does not alter lysosomal ATP content, possibly because of contamination of lysosomes isolated from non-transfected cells. E, reduced ATP content in lysosomes of mSLC17A9 knockdown C2C12 cells. The experiment was repeated three times in triplicate. **, p < 0.01.
FIGURE 6.
FIGURE 6.
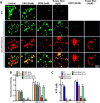
DIDS and Evans blue blocked the ATP transport activity of overexpressed SLC17A9. A, higher (20 μm) concentrations of DIDS and Evans blue are required to block ATP accumulation in lysosomes expressing mSLC17A9-GFP. Quinacrine fluorescence served to monitor ATP levels in lysosomes. WT COS1 cells and cells transiently overexpressing mSLC17A9-mCherry were treated with CBX (20 μm), 5 μm or 20 μm DIDS, or Evans blue. At 5 μm, DIDS or Evans blue treatment significantly reduced ATP content in lysosomes in WT COS1 cells but not in mSLC17A9-mCherry overexpressing cells. DIDS and Evans blue at 20 μm had a dramatic effect in reducing ATP accumulation in lysosomes of mSLC17A9-mCherry-expressing COS1 cells. CBX treatment did not have a significant effect on lysosomal ATP levels. B, quinacrine fluorescence intensity of the images in A. **, p < 0.01; ND, non-detectable. C, measurement of ATP levels in lysosomes isolated from WT or SLC17A9-overexpressing COS1 cells with or without pretreatment with inhibitors. Higher concentrations of DIDS and Evans blue were required to suppress ATP accumulation in lysosomes of mSLC17A9-mCherry-expressing COS1 cells. GPN was used to release lysosomal ATP. The experiment was repeated three times in triplicate. **, p < 0.01.
FIGURE 7.
FIGURE 7.
Suppression of SLC17A9 is associated with cell death. A, PI staining of C2C12 cells overexpressing Lamp1-GFP or Lamp1-GFP and mSLC17A9-shRNA. SLC17A9 knockdown significantly increased the percentage of PI-positive cells. B, percentage of PI+ adherent GFP+ cells from A. **, p < 0.01; NS, not significant. C and D, DIDS (5 or 20 μm) but not CBX (20 μm) treatment dramatically increased the percentage of PI+ cells. COS1 cells were treated with CBX (20 μm) or DIDS (5 or 20 μm) for 24 h and stained with PI. The percentage of PI+ cells induced by DIDS (5 μm) was decreased significantly when mSLC17A9-GFP was overexpressed. **, p < 0.01. E, the percentage of cell viability indicated by the lactate dehydrogenase assay in C2C12 cell culture supernatants increases following DIDS treatment or mSLC17A9 knockdown. Supernatants of knockdown cells or cells treated with either 5 or 20 μm of DIDS for 24 h were collected and assayed for lactate dehydrogenase activity. A positive control defining 100% cell death was created by treating cells with 5% Triton X-100 for 20 min at room temperature. The experiment was repeated three times in triplicate. *, p < 0.05; **, p < 0.01.
FIGURE 8.
FIGURE 8.
SLC17A9 inhibition promotes lysosomal dysfunction. A, decreased DQ-BSA fluorescence in lysosomes of C2C12 mSLC17A9 knockdown cells. C2C12 cells were transfected with Lamp1-GFP plus SLC17A9-shRNA or Lamp1-GFP plus scrambled shRNA control. 24 h after transfection, cells were loaded with DQ-BSA and analyzed by confocal microscopy. B, treatment with DIDS but not CBX reduces DQ-BSA fluorescence. WT cells treated with DIDS or CBX for 24 h and loaded with DQ-BSA. DIDS at 5 μm but not 20 μm induced loss of DQ-BSA staining, an effect rescued by SLC17A9 overexpression. C, C2C12 cells were transfected with Lamp1-GFP plus SLC17A9-shRNA or Lamp1-GFP plus pSUPER vector. Lysosomal autofluorescence was observed in mSLC17A9 knockdown cells but not in control Lamp1-GFP cells. Autofluorescence was detected at an excitation wavelength of 480 nm. D, DIDS-treated cells showed lysosomal autofluorescence, but non-treated and CBX-treated cells did not. Cells were transfected with Lamp1-Cherry to label lysosomes and treated with either CBX (20 μm) or DIDS (20 μm) for 8 h. The experiment was repeated three times, and representative images are shown.

References

    1. Hediger M. A., Clémençon B., Burrier R. E., Bruford E. A. (2013) The ABCs of membrane transporters in health and disease (SLC series): introduction. Mol. Aspects Med. 34, 95–107 - PMC - PubMed
    1. Fredriksson R., Nordström K. J., Stephansson O., Hägglund M. G., Schiöth H. B. (2008) The solute carrier (SLC) complement of the human genome: phylogenetic classification reveals four major families. FEBS Lett. 582, 3811–3816 - PubMed
    1. Sawada K., Echigo N., Juge N., Miyaji T., Otsuka M., Omote H., Yamamoto A., Moriyama Y. (2008) Identification of a vesicular nucleotide transporter. Proc. Natl. Acad. Sci. U.S.A. 105, 5683–5686 - PMC - PubMed
    1. Tokunaga A., Tsukimoto M., Harada H., Moriyama Y., Kojima S. (2010) Involvement of SLC17A9-dependent vesicular exocytosis in the mechanism of ATP release during T cell activation. J. Biol. Chem. 285, 17406–17416 - PMC - PubMed
    1. Geisler J. C., Corbin K. L., Li Q., Feranchak A. P., Nunemaker C. S., Li C. (2013) Vesicular nucleotide transporter-mediated ATP release regulates insulin secretion. Endocrinology 154, 675–684 - PMC - PubMed

Publication types

MeSH terms

Substances