. 2012 Feb 15;2(1):33-60.
doi: 10.3390/brainsci2010033.

Unconscious Cueing via the Superior Colliculi: Evidence from Searching for Onset and Color Targets

Affiliations

Unconscious Cueing via the Superior Colliculi: Evidence from Searching for Onset and Color Targets

Isabella Fuchs et al. Brain Sci. .

Abstract

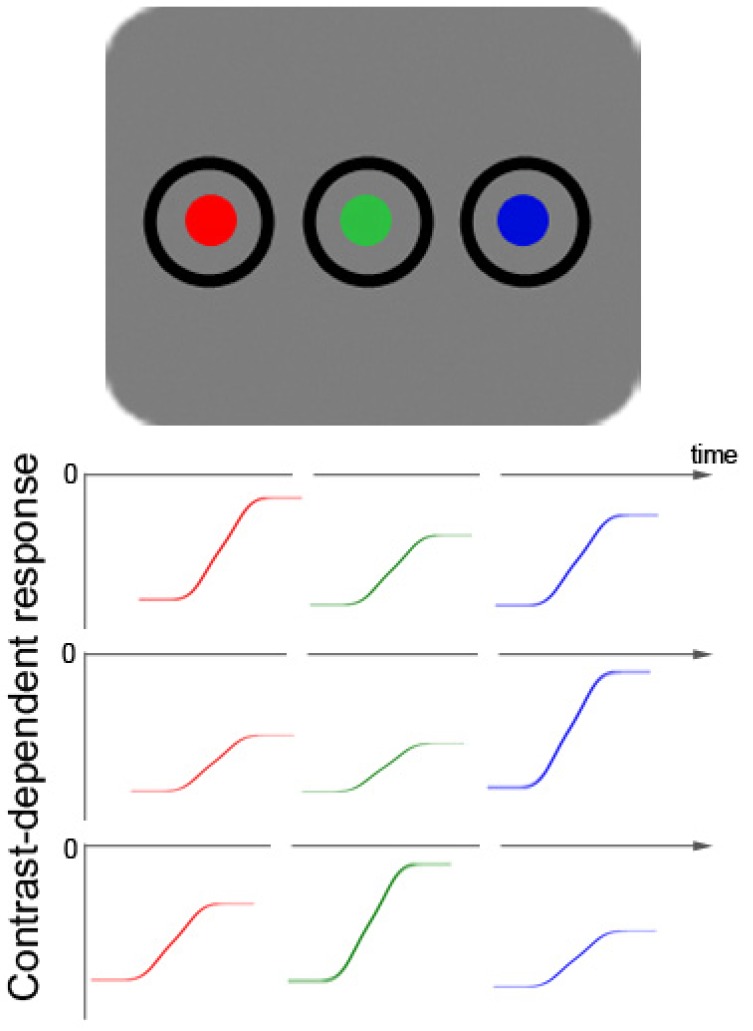
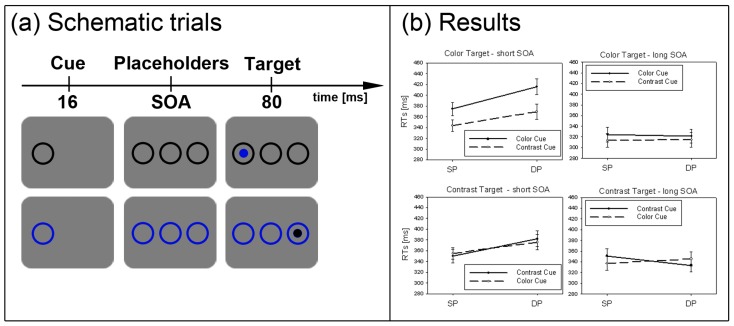
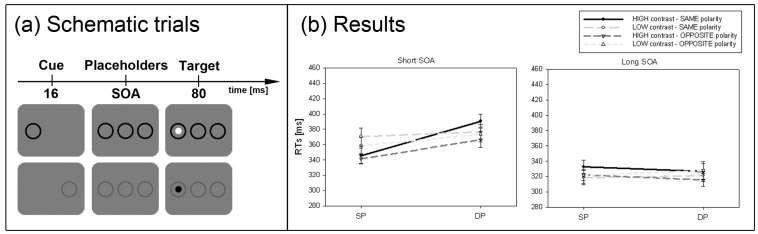
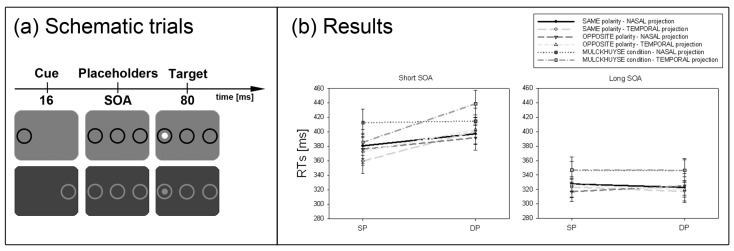
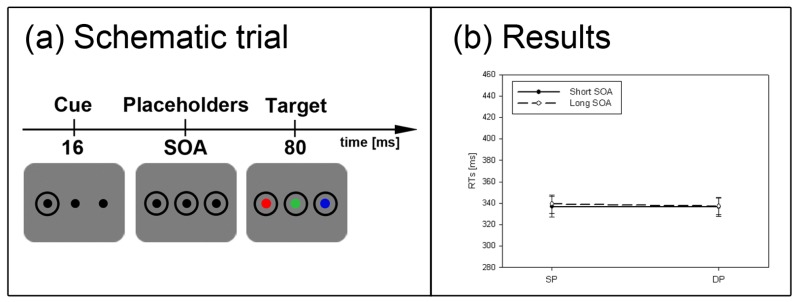
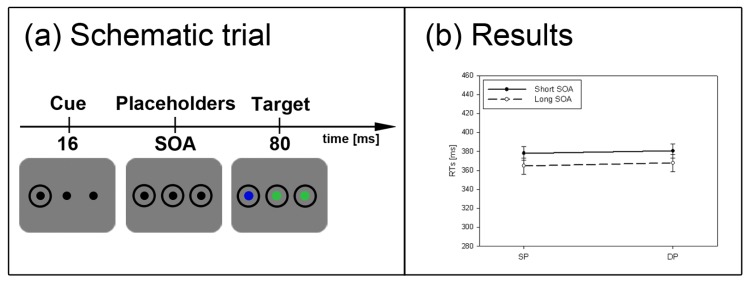
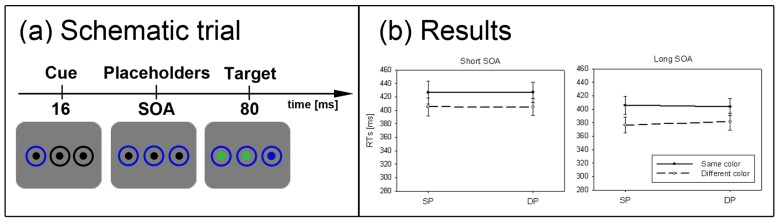
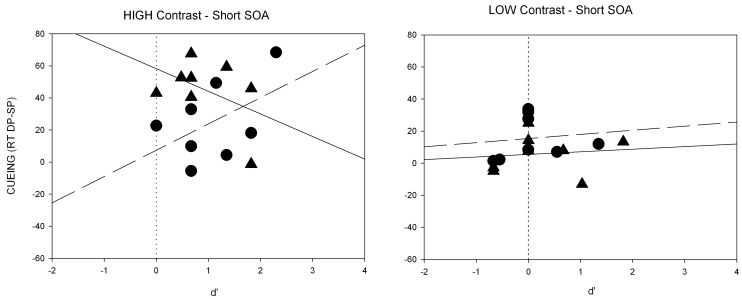
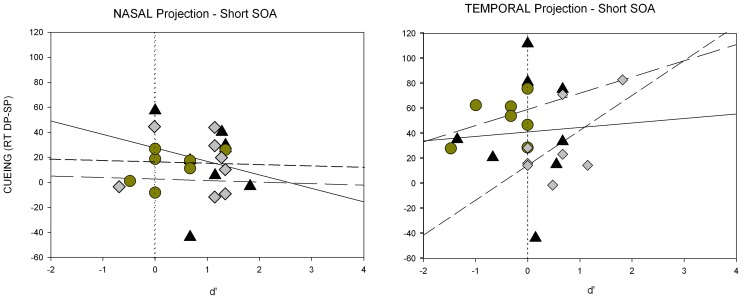
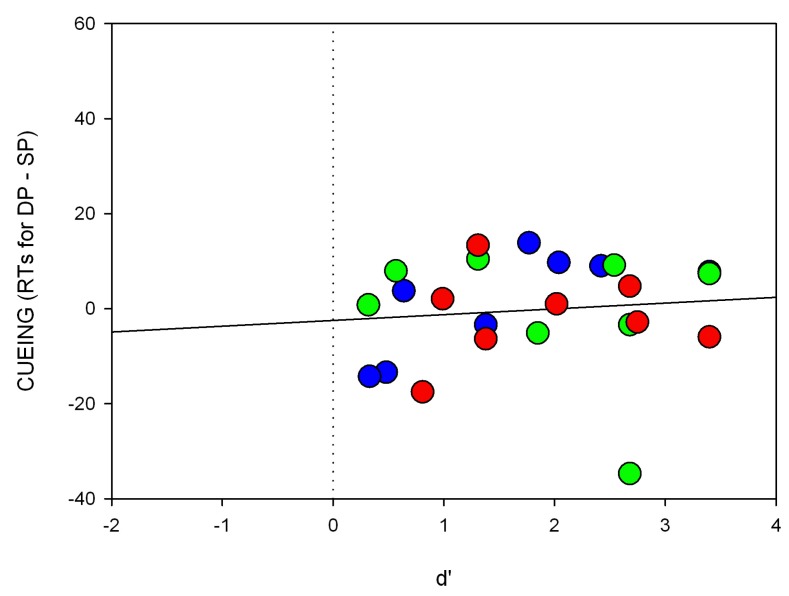
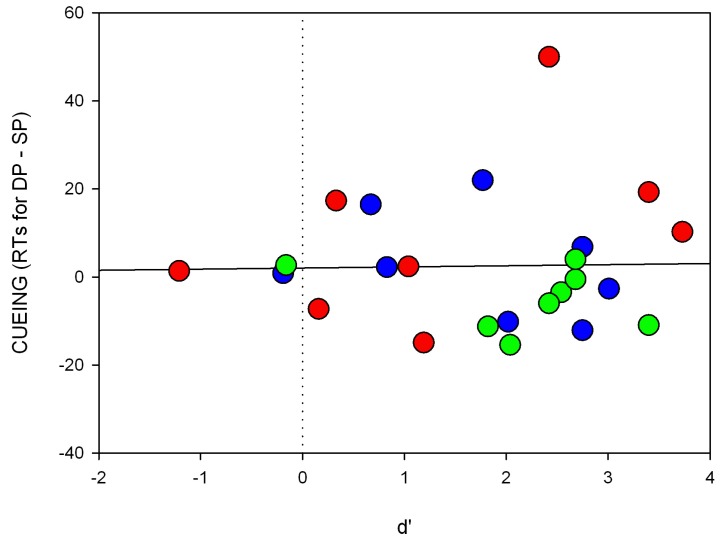
According to the bottom-up theory of attention, unconscious abrupt onsets are highly salient and capture attention via the Superior Colliculi (SC). Crucially, abrupt onsets increase the perceived contrast. In line with the SC hypothesis, unconscious abrupt-onset cues capture attention regardless of the cue color when participants search for abrupt-onset targets (Experiment 1). Also, stronger cueing effects occur for higher than lower contrast cues (Experiment 2) and for temporally, rather than nasally, presented stimuli (Experiment 3). However, in line with the known color-insensitivity of the SC, the SC pathway is shunted and unconscious abrupt-onset cues no longer capture attention when the participants have to search for color-defined targets (Experiment 4) or color-singleton targets (Experiment 5). When using color change cues instead of abrupt-onset cues, the cueing effect also vanishes (Experiment 6). Together the results support the assumption that unconscious cues can capture attention in different ways, depending on the exact task of the participants, but that one way is attentional capture via the SC. The present findings also offer a reconciliation of conflicting results in the domain of unconscious attention.


Figures

Figure 1
Figure 1
Schematic picture of a color-target display with two additional color distractors (top row). Below that, fictitious color-contrast dependent response functions for three different participants are plotted for all three different hues (rows 2–4). Colors with objectively the same luminance are able to produce different subjectively perceived contrasts in different observers due to varying sensitivity to particular hues. The figure demonstrates how three fictitious participants differ in their sensitivity and have their respective maximal contrast-dependent response in the range of red (row 2), blue (row 3), or green (row 4) colors. This figure illustrates the heterogeneity of the resulting contrast differences between participants, as well as the fact that the contrast differences are relatively small. The small size of the color contrast differences can be inferred from a comparison of the respective sizes of differences of: (1) background luminance responses (at 0) and the asymptotic maximum value of each color-elicited response; and (2) the background and black (this is the starting value of each color-elicited contrast-dependent response function). Figure 1 also depicts the way in which colors of targets and distractors were realized in the current Experiments 4 to 6: as changes from black to red, green, or blue.
Figure 2
Figure 2
Experiment 1. (a) Depicted are schematic examples of trials. The top row shows a contrast cue and a blue target (same position (SP) condition). The bottom row depicts a color cue and a black target (different position (DP) condition). (b) Depicted are mean reaction times (RTs) and standard errors of the mean (error bars) of all participants, plotted separately for the short (left side) and long Stimulus Onset Asynchrony (SOA) (right side) and for color targets (top row) and contrast targets (bottom row). Results are shown for SP (left side of each panel) and DP conditions (right side of each panel). Results are plotted separately in each panel for cues of the same contrast or color (solid line) and different contrast or color cues (dashed line).
Figure 3
Figure 3
Experiment 2. (a) Depicted are examples of schematic trials. The top row depicts an opposite-polarity cue at the same position as the target in the high-contrast condition (black cue and white target). The bottom row shows a same-polarity cue in the low-contrast condition (DP condition). (b) Depicted are mean RTs and standard errors of the mean (error bars) of all participants for the short (left panel) and long SOA (right panel). Results are plotted for all conditions separately (see figure legend).
Figure 4
Figure 4
Experiment 3. (a) Depicted are schematic examples of trials. The top row depicts an opposite-polarity cue at the same position as the target (black cue and white target). The bottom row shows a DP cue in the Mulckhuyse condition (where cue and target always shared the same contrast polarity). Note, that the depicted luminance of the items is just for illustration purposes and does not equal the original luminance. Furthermore, the cues, targets, and outer rings were presented at an increased distance to the centre compared to all other experiments. (b) Depicted are the mean RTs and standard errors of the mean (error bars) of all participants for the short (left panel) and long SOA (right panel). Results are plotted for all conditions separately (see figure legend).
Figure 5
Figure 5
Experiment 4. (a) Depicted is a schematic example trial. For participants searching for a red target, the depicted trial is an example of the SP condition, whereas for participants searching for a blue target, the same trial depicts a DP condition. (b) Depicted are the mean RTs and standard errors of the mean (error bars) of all participants for the short (solid line) and long SOA (dashed line).
Figure 6
Figure 6
Experiment 5. (a) Depicted is a schematic example trial (blue target, SP condition). (b) Depicted are the mean RTs and standard errors of the mean (error bars) of all participants, plotted separately for the short (solid line) and long SOA (dashed line).
Figure 7
Figure 7
Experiment 6. (a) Depicted is a schematic example trial (blue target, DP and same-color cue). (b) Depicted are the mean RTs and standard errors of the mean (error bars) of all participants. Results are plotted separately for the short (left panel) and long SOA (right panel), for same color cues (solid line) and cues of a different color (dashed line).
Figure A1
Figure A1
Individual scatter plots for Experiment 1. Shown are RT differences (y-axis) and the respective d’-value (x-axis) for each participant separately. Panels depict results of the short SOA (cueing effects, i.e., mean RTs for DP minus RTs for SP condition). Values are plotted separately for same contrast/color conditions (triangles, solid regression line) and different color/contrast conditions (circles, dashed regression line). For color targets (panel on the left side), the symbols are plotted in the corresponding target color, for contrast targets (panel on the right side) the color of the symbols correspond to the cue color.
Figure A2
Figure A2
Individual scatter plots of the short SOA for Experiment 2. Shown are RT differences (cueing effects, i.e., mean RTs for DP minus RTs for SP condition on the y-axis) and the respective d’-value (on the x-axis) for each participant separately. Panels depict results for high-contrast (left side) and low-contrast cues (right side), separately. In each panel values are displayed for cues with the same polarity as the target (triangles; solid regression line) and with opposite polarity (circles; dashed regression line).
Figure A3
Figure A3
Individual scatter plots of the short SOA for Experiment 3. Shown are RT differences (cueing effects, i.e., mean RTs for DP minus RTs for SP condition on the y-axis) and the respective d’-value (on the x-axis) for each participant separately. Panels depict results separately for nasal (left side) and temporal hemifield projection (right side). Within each panel, values for all three cue conditions are shown: same polarity cues (triangles; solid regression line), opposite polarity cues (diamonds; short dashed regression line) and Mulckhuyse condition (circles; long dashed regression line).
Figure A4
Figure A4
Individual scatter plots of the short SOA for Experiment 4. Shown are RT differences (cueing effects, y-axis) and the respective d’-value (x-axis) for each participant separately. The colors of the circles correspond to the respective searched-for target color.
Figure A5
Figure A5
Individual scatter plots for Experiment 5. Shown are RT differences (cueing, y-axis) and the respective d’-value (x-axis) of the short SOA for each participant separately. The colors of the circles correspond to the respective searched-for target color.
Figure A6
Figure A6
Individual scatter plots of the short SOA for Experiment 6. Shown are RT differences (cueing effects, y-axis) and the respective d’-value (x-axis) for each participant separately. Values are plotted separately for cues with the same (triangles; solid regression line) and a different color (circles; dashed regression line). Symbols are colored corresponding to the respective searched-for target color.

Similar articles

Cited by

References

    1. Egeth H.E., Yantis S. Visual attention: Control, representation, and time course. Annu. Rev. Psychol. 1997;48:269–297. doi: 10.1146/annurev.psych.48.1.269. - DOI - PubMed
    1. Lamme V.A. Why visual attention and awareness are different. Trends Cogn. Sci. 2003;7:12–18. doi: 10.1016/S1364-6613(02)00013-X. - DOI - PubMed
    1. Neisser U. Cognitive Psychology. Appleton-Century-Crofts; New York, NY, USA: 1967.
    1. Wundt W. Grundriß der Psychologie (Compendium of Psychology) Engelmann; Leipzig, Germany: 1896.
    1. Van Boxtel J.J.A., Tsuchiya N., Koch C. Consciousness and attention: On sufficiency and necessity. Front. Psychol. 2010;1:217. doi: 10.3389/fpsyg.2010.00217.. - DOI - PMC - PubMed

LinkOut - more resources