

Silencing miR-146a influences B cells and ameliorates experimental autoimmune myasthenia gravis
- PMID: 24962817
- PMCID: PMC4264910
- DOI: 10.1111/imm.12347
Silencing miR-146a influences B cells and ameliorates experimental autoimmune myasthenia gravis
Abstract
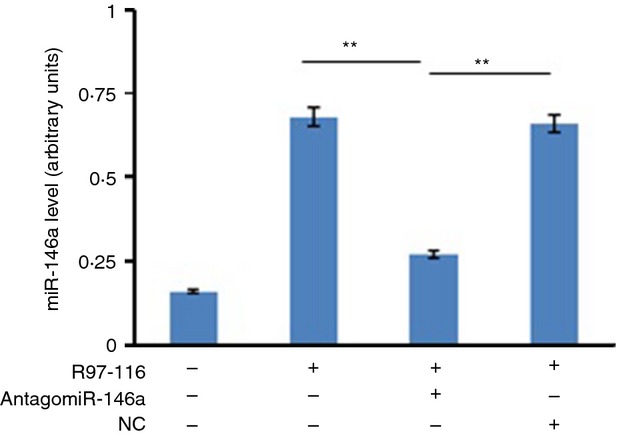
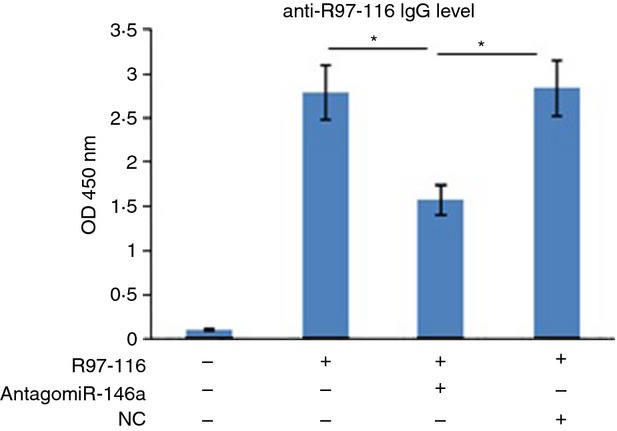
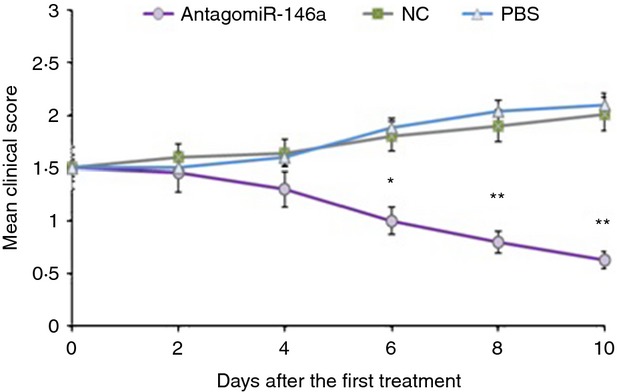
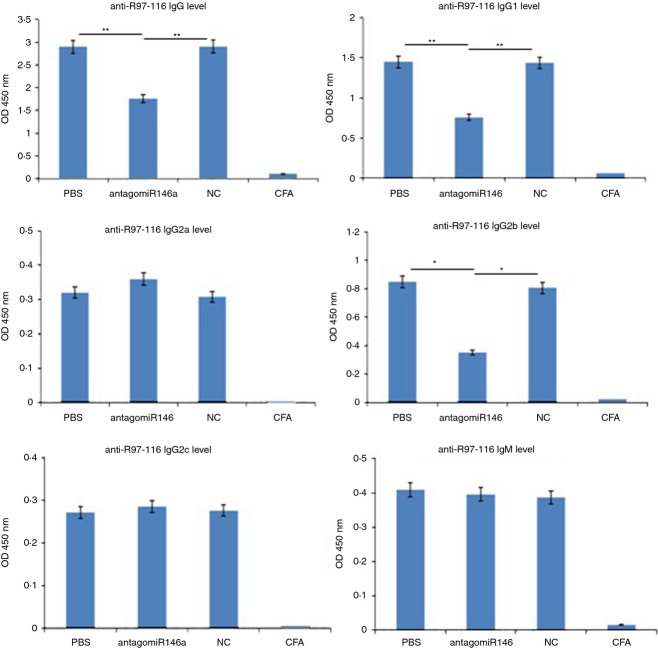
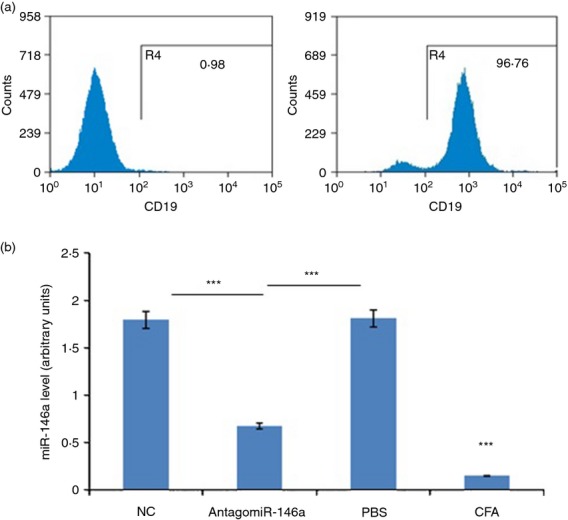
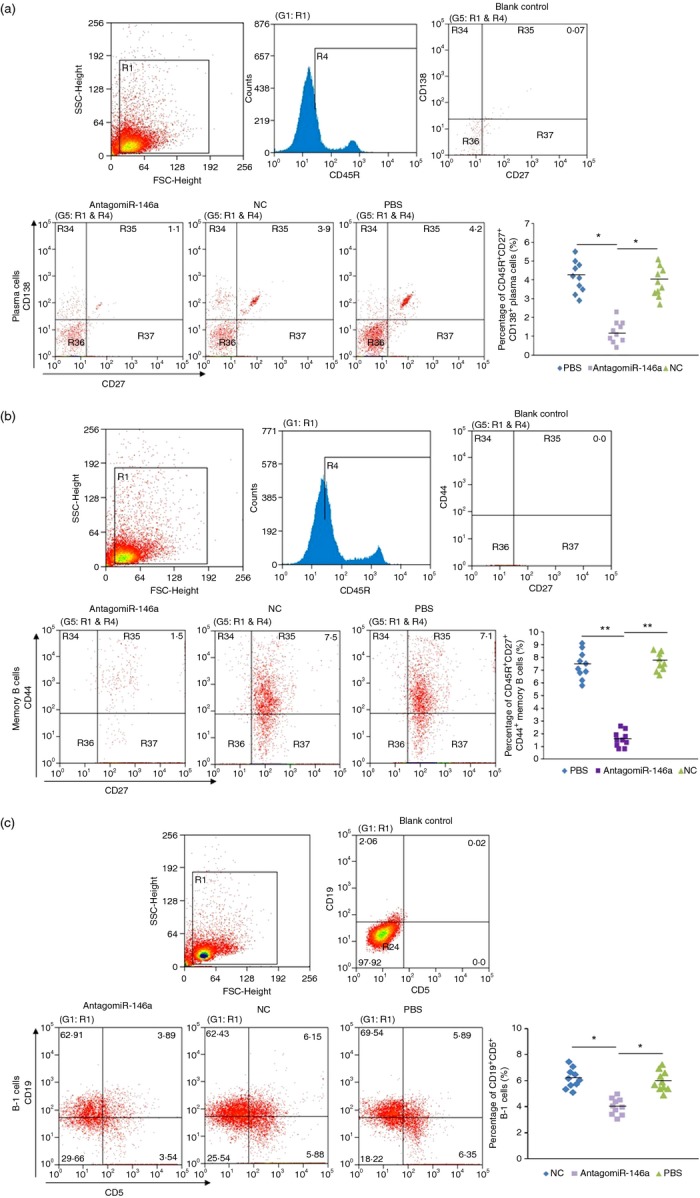
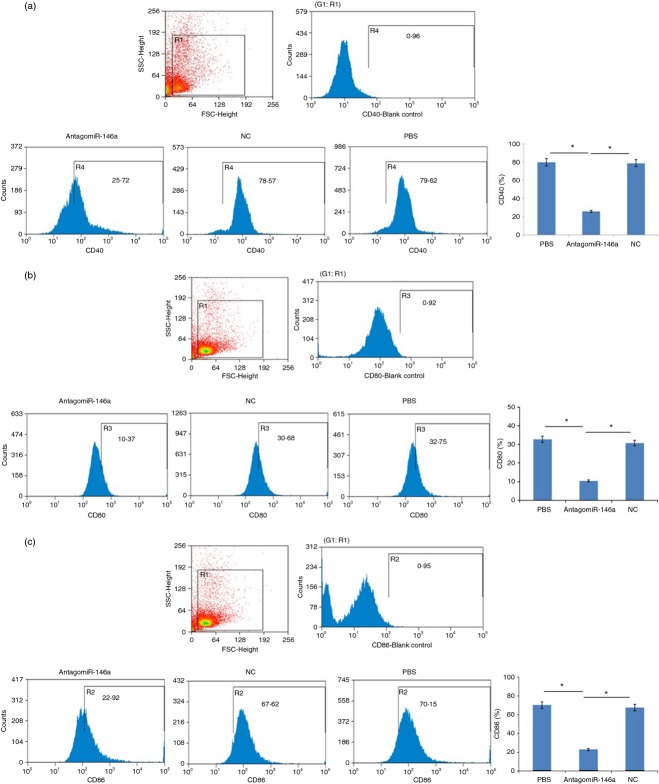
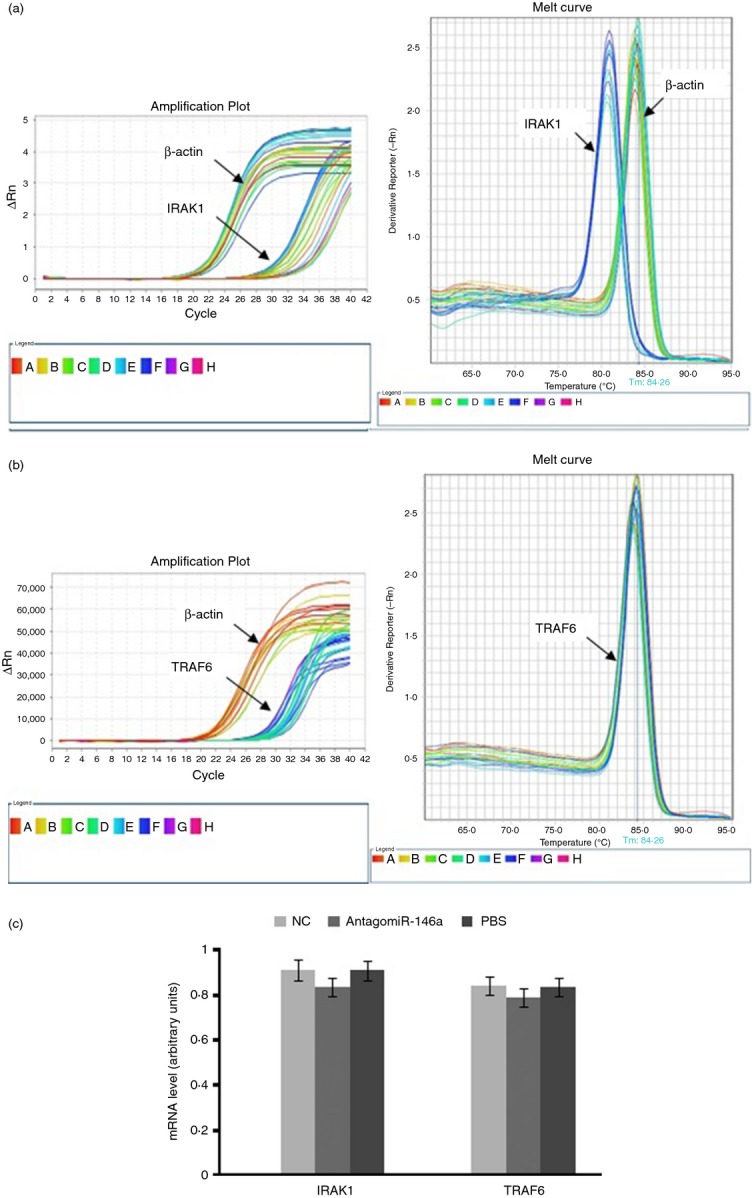
MicroRNAs have been shown to be important regulators of immune homeostasis as patients with aberrant microRNA expression appeared to be more susceptible to autoimmune diseases. We recently found that miR-146a was up-regulated in activated B cells in response to rat acetylcholine receptor (AChR) α-subunit 97-116 peptide, and this up-regulation was significantly attenuated by AntagomiR-146a. Our data also demonstrated that silencing miR-146a with its inhibitor AntagomiR-146a effectively ameliorated clinical myasthenic symptoms in mice with ongoing experimental autoimmune myasthenia gravis. Furthermore, multiple defects were observed after miR-146a was knocked down in B cells, including decreased anti-R97-116 antibody production and class switching, reduced numbers of plasma cells, memory B cells and B-1 cells, and weakened activation of B cells. Previously, miR-146a has been identified as a nuclear factor-κB-dependent gene and predicted to base pair with the tumour necrosis factor receptor-associated factor 6 (TRAF6) and interleukin-1 receptor-associated kinase 1 (IRAK1) genes to regulate the immune response. However, our study proved that miR-146a inhibition had no effect on the expression of TRAF6 and IRAK1 in B cells. This result suggests that the function of miR-146a in B cells does not involve these two target molecules. We conclude that silencing miR-146a exerts its therapeutic effects by influencing the B-cell functions that contribute to the autoimmune pathogenesis of myasthenia gravis.
Keywords: RNA interference; experimental autoimmune myasthenia gravis; interleukin-1 receptor-associated kinase-1; miR-146a; tumour necrosis factor receptor-associated factor-6.
© 2014 John Wiley & Sons Ltd.
Figures
Similar articles
-
miR-146a ameliorates liver ischemia/reperfusion injury by suppressing IRAK1 and TRAF6.PLoS One. 2014 Jul 2;9(7):e101530. doi: 10.1371/journal.pone.0101530. eCollection 2014. PLoS One. 2014. PMID: 24987958 Free PMC article.
-
Delivery of an miR155 inhibitor by anti-CD20 single-chain antibody into B cells reduces the acetylcholine receptor-specific autoantibodies and ameliorates experimental autoimmune myasthenia gravis.Clin Exp Immunol. 2014 May;176(2):207-21. doi: 10.1111/cei.12265. Clin Exp Immunol. 2014. PMID: 24387321 Free PMC article.
-
miR-146a in Myasthenia Gravis Thymus Bridges Innate Immunity With Autoimmunity and Is Linked to Therapeutic Effects of Corticosteroids.Front Immunol. 2020 Mar 10;11:142. doi: 10.3389/fimmu.2020.00142. eCollection 2020. Front Immunol. 2020. PMID: 32210951 Free PMC article.
-
MicroRNA in TLR signaling and endotoxin tolerance.Cell Mol Immunol. 2011 Sep;8(5):388-403. doi: 10.1038/cmi.2011.26. Epub 2011 Aug 8. Cell Mol Immunol. 2011. PMID: 21822296 Free PMC article. Review.
-
Unveiling the therapeutic potential of miR-146a: Targeting innate inflammation in atherosclerosis.J Cell Mol Med. 2024 Oct;28(19):e70121. doi: 10.1111/jcmm.70121. J Cell Mol Med. 2024. PMID: 39392102 Free PMC article. Review.
Cited by
-
Function of miR-146a-5p in Tumor Cells As a Regulatory Switch between Cell Death and Angiogenesis: Macrophage Therapy Revisited.Front Immunol. 2018 Jan 5;8:1931. doi: 10.3389/fimmu.2017.01931. eCollection 2017. Front Immunol. 2018. PMID: 29354134 Free PMC article.
-
Animal models of myasthenia gravis: utility and limitations.Int J Gen Med. 2016 Mar 4;9:53-64. doi: 10.2147/IJGM.S88552. eCollection 2016. Int J Gen Med. 2016. PMID: 27019601 Free PMC article. Review.
-
Mechanism by which TRAF6 Participates in the Immune Regulation of Autoimmune Diseases and Cancer.Biomed Res Int. 2020 Nov 26;2020:4607197. doi: 10.1155/2020/4607197. eCollection 2020. Biomed Res Int. 2020. PMID: 33294443 Free PMC article. Review.
-
Myasthenia Gravis: Novel Findings and Perspectives on Traditional to Regenerative Therapeutic Interventions.Aging Dis. 2023 Aug 1;14(4):1070-1092. doi: 10.14336/AD.2022.1215. Aging Dis. 2023. PMID: 37163445 Free PMC article.
-
miRNA-34b/c regulates mucus secretion in RSV-infected airway epithelial cells by targeting FGFR1.J Cell Mol Med. 2021 Nov;25(22):10565-10574. doi: 10.1111/jcmm.16988. Epub 2021 Oct 12. J Cell Mol Med. 2021. PMID: 34636482 Free PMC article.
References
-
- Drachman DB. Myasthenia gravis. N Engl J Med. 1994;330:1797–810. - PubMed
-
- Lindstrom JM, Seybold ME, Lennon VA, Whittingham S, Duane DD. Antibody to acetylcholine receptor in myasthenia gravis. Prevalence, clinical correlates, and diagnostic value. Neurology. 1976;26:1054–9. - PubMed
-
- Berrih-Aknin S, Ragheb S, Le PR, Lisak RP. Ectopic germinal centers, BAFF and anti-B-cell therapy in myasthenia gravis. Autoimmun Rev. 2013;12:885–93. - PubMed
Publication types
MeSH terms
Substances
LinkOut - more resources
Full Text Sources
Other Literature Sources
