. 2014 Oct 15;522(15):3555-74.
doi: 10.1002/cne.23641. Epub 2014 Jul 14.

Cell type-specific spatial and functional coupling between mammalian brain Kv2.1 K+ channels and ryanodine receptors

Affiliations

Cell type-specific spatial and functional coupling between mammalian brain Kv2.1 K+ channels and ryanodine receptors

Danielle Mandikian et al. J Comp Neurol. .

Abstract

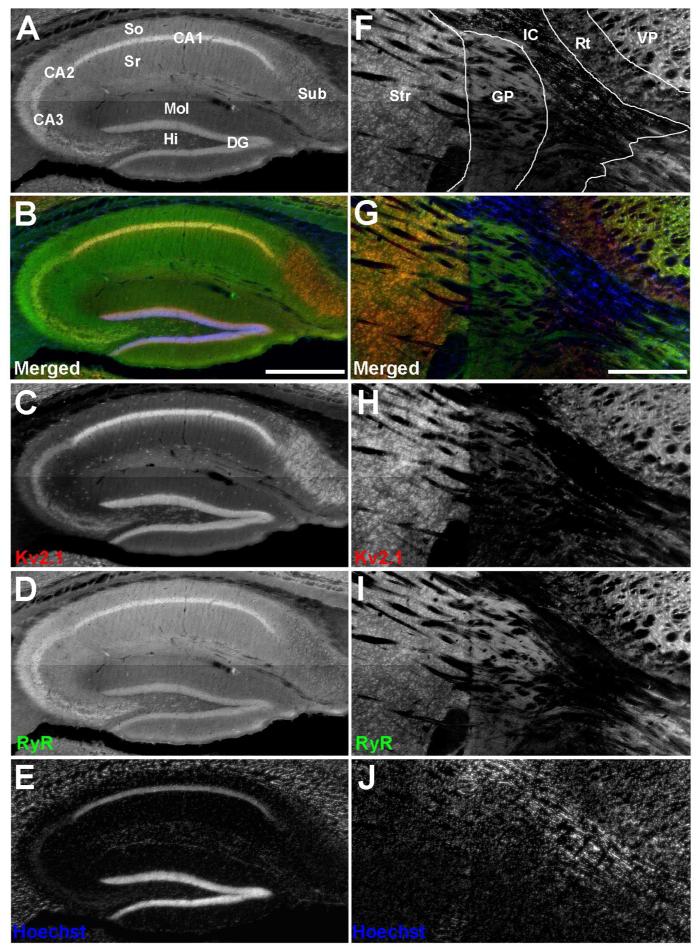
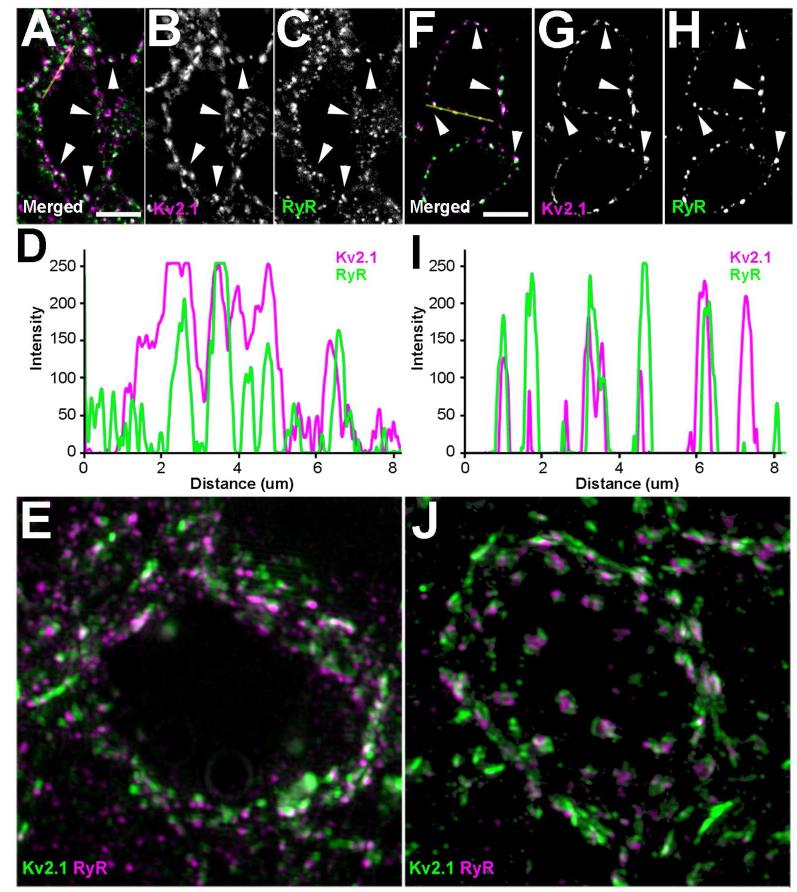
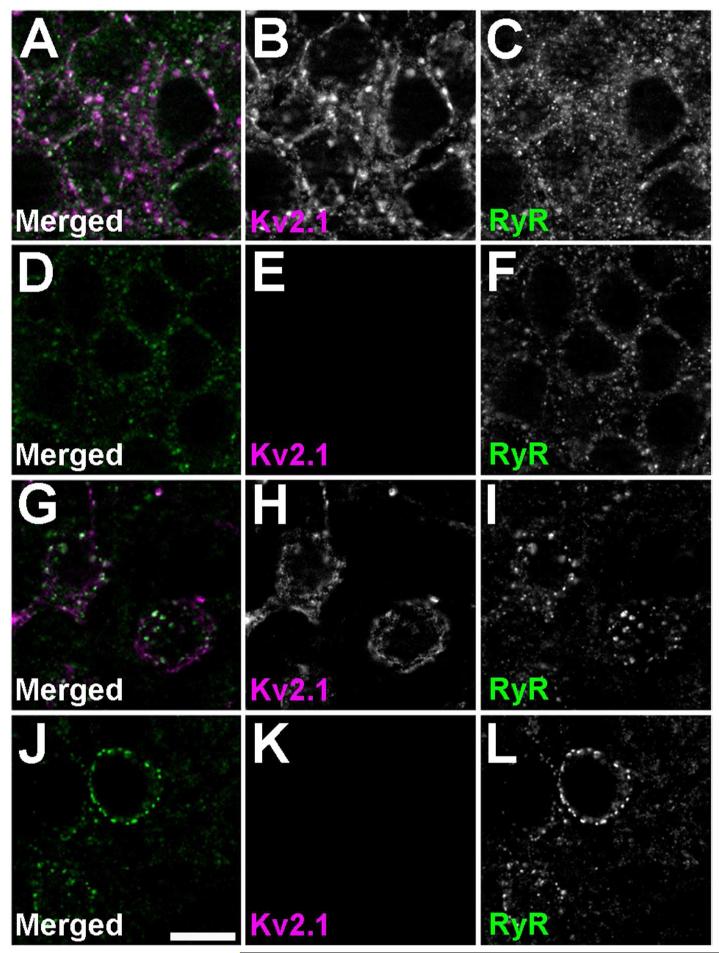
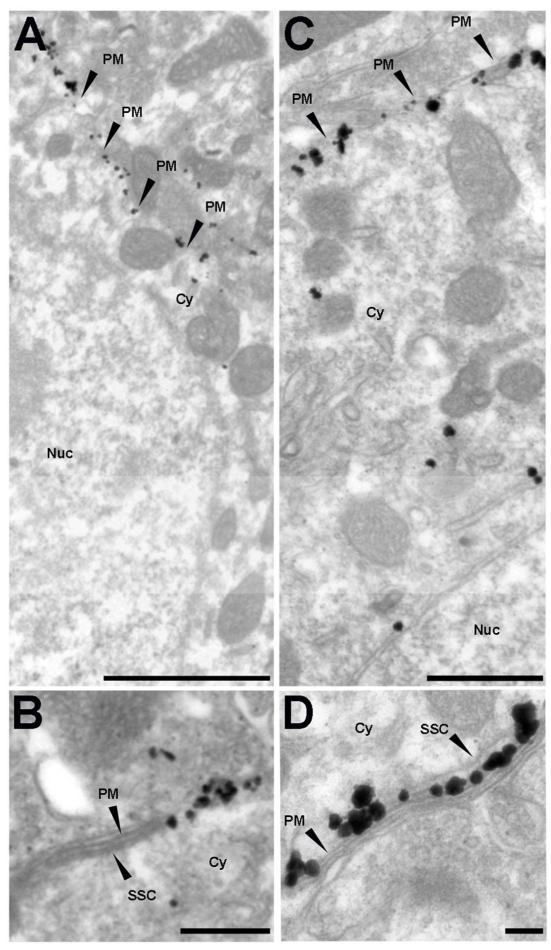
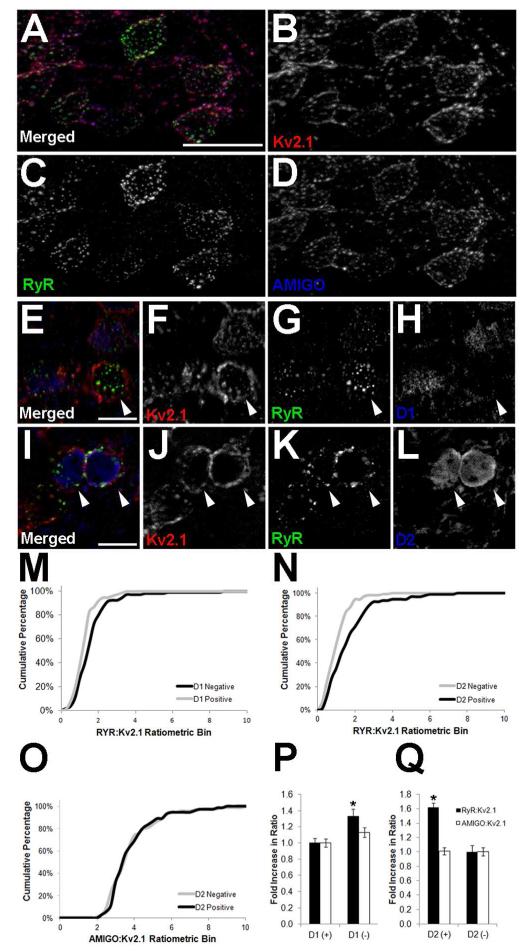
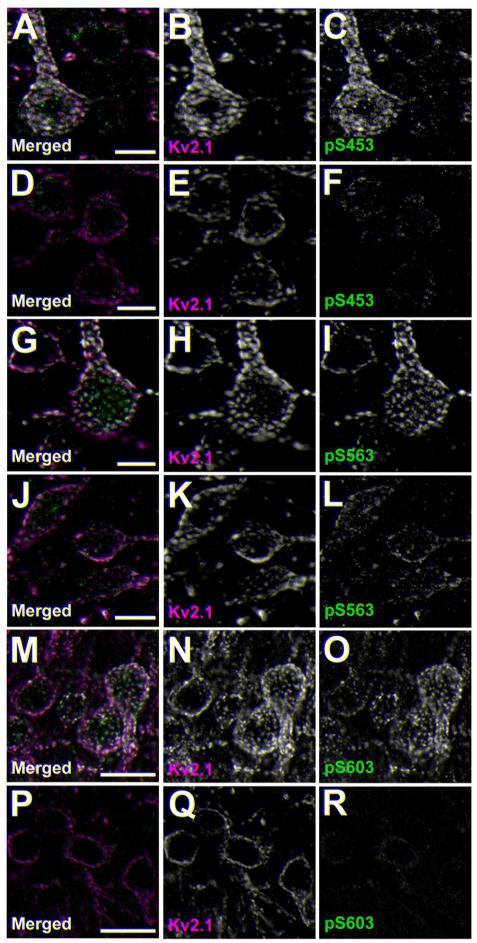
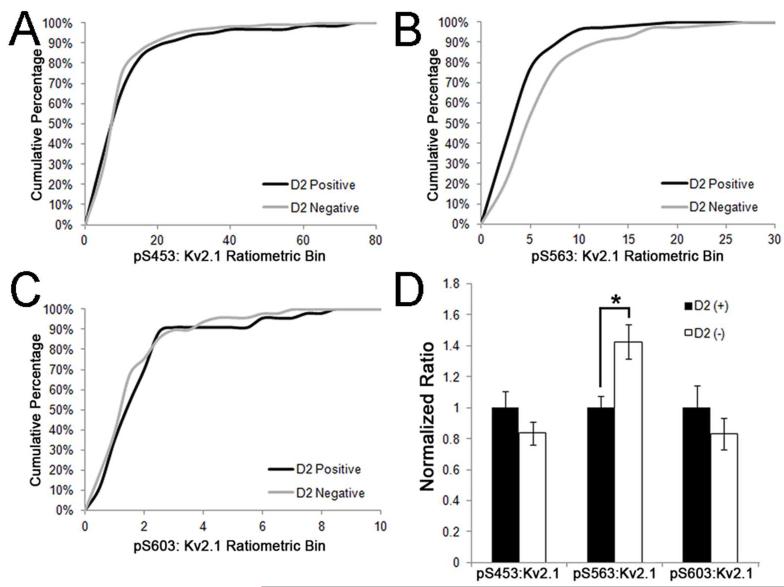
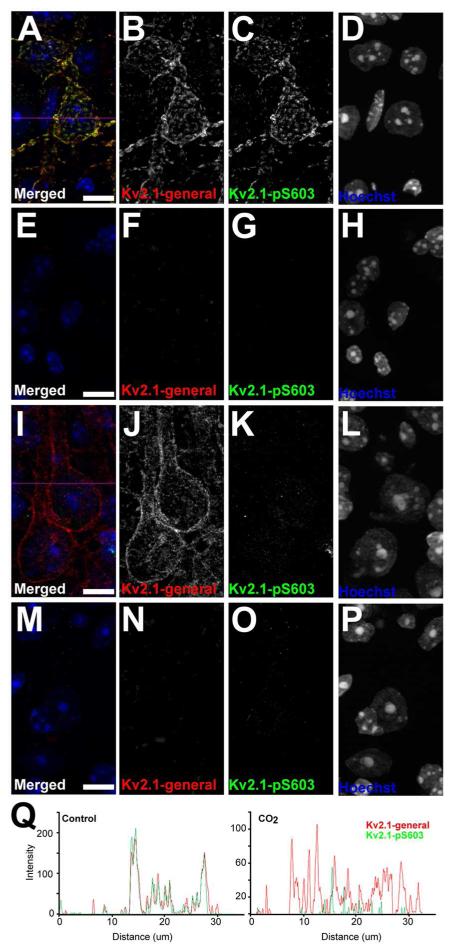
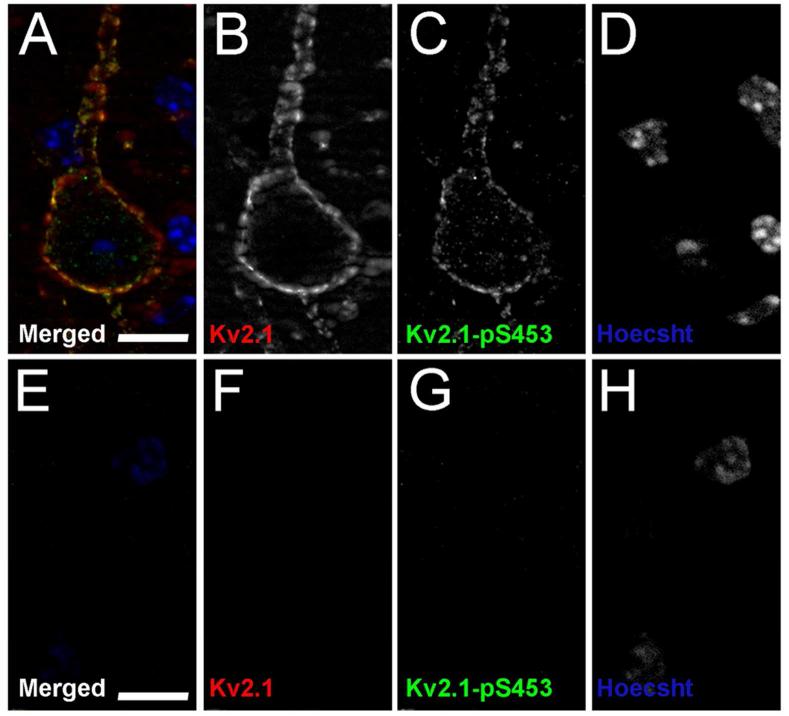
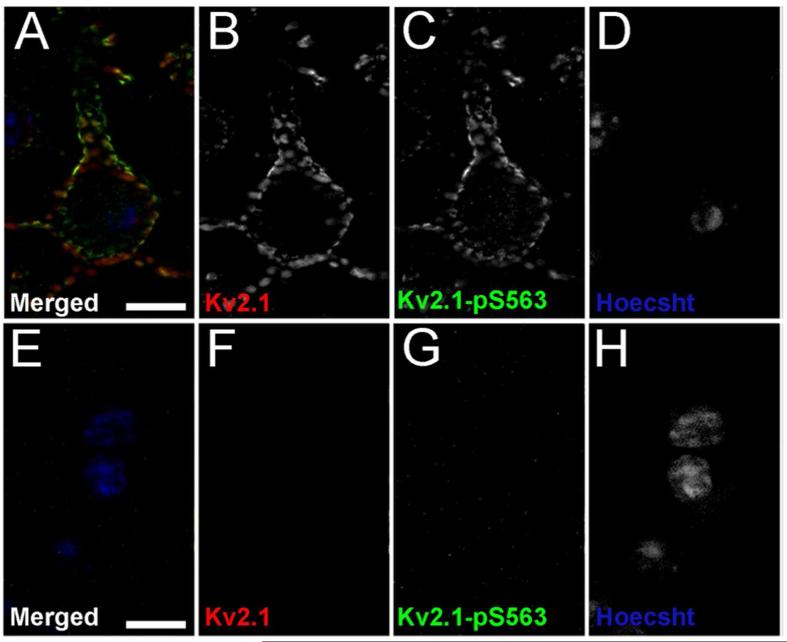
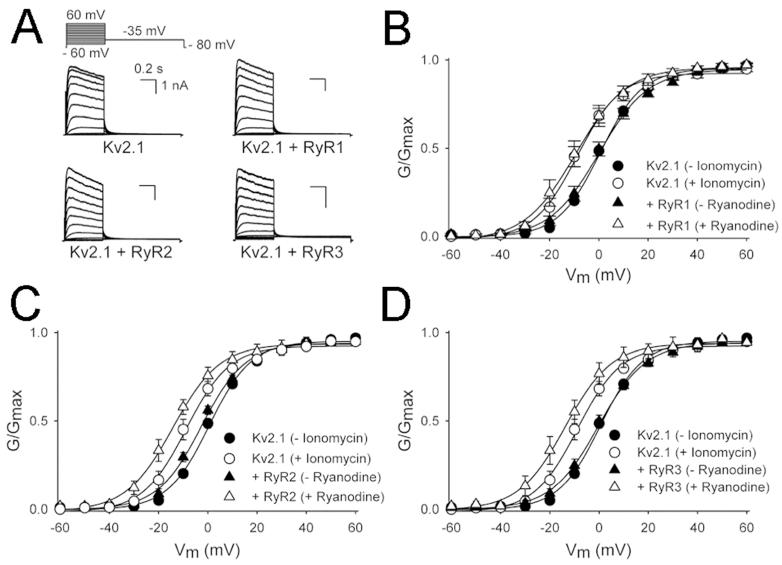
The Kv2.1 voltage-gated K+ channel is widely expressed throughout mammalian brain, where it contributes to dynamic activity-dependent regulation of intrinsic neuronal excitability. Here we show that somatic plasma membrane Kv2.1 clusters are juxtaposed to clusters of intracellular ryanodine receptor (RyR) Ca2+ -release channels in mouse brain neurons, most prominently in medium spiny neurons (MSNs) of the striatum. Electron microscopy-immunogold labeling shows that in MSNs, plasma membrane Kv2.1 clusters are adjacent to subsurface cisternae, placing Kv2.1 in close proximity to sites of RyR-mediated Ca2+ release. Immunofluorescence labeling in transgenic mice expressing green fluorescent protein in specific MSN populations reveals the most prominent juxtaposed Kv2.1:RyR clusters in indirect pathway MSNs. Kv2.1 in both direct and indirect pathway MSNs exhibits markedly lower levels of labeling with phosphospecific antibodies directed against the S453, S563, and S603 phosphorylation site compared with levels observed in neocortical neurons, although labeling for Kv2.1 phosphorylation at S563 was significantly lower in indirect pathway MSNs compared with those in the direct pathway. Finally, acute stimulation of RyRs in heterologous cells causes a rapid hyperpolarizing shift in the voltage dependence of activation of Kv2.1, typical of Ca2+ /calcineurin-dependent Kv2.1 dephosphorylation. Together, these studies reveal that striatal MSNs are distinct in their expression of clustered Kv2.1 at plasma membrane sites juxtaposed to intracellular RyRs, as well as in Kv2.1 phosphorylation state. Differences in Kv2.1 expression and phosphorylation between MSNs in direct and indirect pathways provide a cell- and circuit-specific mechanism for coupling intracellular Ca2+ release to phosphorylation-dependent regulation of Kv2.1 to dynamically impact intrinsic excitability.

Keywords: immunohistochemistry; intracellular Ca2+ release; ion channel; localization; striatum.


Figures

Figure 1
Figure 1
Distinct patterns of Kv2.1 and RyR coexpression in mouse brain. Mouse brain sections were double immunofluorescence labeled for Kv2.1 (red) and RyR (green), and nuclei were labeled with Hoechst 33258 (blue). Images were acquired with an epifluorescence microscope using an automated stage for mosaic images of brain regions. A-E: Hippocampus. F-J: Striatum and adjacent brain regions. A: Grayscale version of the color image shown in panel B labeled for anatomical regions. B: Merged image of triple immunofluorescence labeling. C: Labeling for Kv2.1. D: Labeling for RyR. E: Labeling for nuclei with Hoechst. F: Grayscale version of the color image shown in panel G labeled for anatomical regions. G: Merged image of triple immunofluorescence labeling. H: Labeling for Kv2.1. I: Labeling for RyR. J: Labeling for nuclei with Hoechst. Labels on panel A: Sub: Subiculum; So: Stratum oriens; Sr: Stratum radiatum; CA1-CA3: respective pyramidal cell layers; Mol: Dentate gyrus molecular layer; HI: Dentate gyrus hilus; DG: Dentate gyrus granule cell layer. Labels on panel F: Str: Striatum; Gp, Globus pallidus; IC, Internal capsule; RT, Reticular nucleus (Thalamic); VP, Ventral posterior nucleus (Thalamic). Scale bar in panel B is 500 μm and is for panels A-E. Scale bar in panel G is 500 μm and is for panels F-J.
Figure 2
Figure 2
Kv2.1 clusters are juxtaposed to clusters of RyR in the mouse brain. Mouse brain sections were double immunofluorescence labeled for Kv2.1 (magenta) and RyR (green). Images in panels A-C and F-H were acquired using an epifluorescence microscope equipped with an ApoTome. Yellow lines in A and F represent line traces of fluorescence intensities depicted in D and I respectively. Line traces were generated using the plot profile function in ImageJ for each channel. High-resolution images in panels E and J were acquired with Zeiss Elyra system (SR-SIM) and Z-stacks were reconstructed using Zen software. A-C: Single optical section of CA1 pyramidal neuron. A: Merged image of double immunofluorescence labeling. B: Labeling for Kv2.1. C: Labeling for RyR. E: CA1 pyramidal neuron imaged using SR-SIM. F-H: Single optical section of a striatal MSN neuron. F: Merged image of double immunofluorescence labeling. G: Labeling for Kv2.1. H: Labeling for RyR. H: Striatal MSNs imaged using SR-SIM. White arrowheads indicate prominent examples of juxtaposed clusters of Kv2.1 and RyR. Scale bar in panel A is 5 μm and is for panels A-C. Scale bar in panels E, J are 1 μm. Scale bar in panel F is 5 μm and is for panels E-G.
Figure 3
Figure 3
RyR expression and localization is not grossly altered in brains of Kv2.1-KO mice. Kv2.1 labeling is shown in magenta, and RyR labeling in green. Images were acquired using an epifluorescence microscope equipped with an ApoTome. Images of single optical sections from mouse brain sections prepared from A-C, G-I: Wild type; and D-F, J-L: Kv2.1-KO mice. A-F: CA1 pyramidal neurons; G-L: striatal MSNs. A, D, G, J: Merged images. B, E, H, K: Kv2.1 labeling. C, F, I, L: RyR labeling. Scale bar in panel J is 10 μm and is for all panels.
Figure 4
Figure 4
Kv2.1 clusters on the plasma membrane near subsurface cisternae in striatal and thalamic neurons. Ultrastructural localization of Kv2.1 in A, B: striatal and C, D: thalamic neurons, as revealed by pre-embedding immunogold labeling method. B and D depict Kv2.1 clusters adjacent to sub-surface cisternae in striatal and thalamic neurons respectively. Black arrowheads point to specific structures. SSC: subsurface cisternae; PM: plasma membrane; Cy: cytosol; Nuc: nucleus. Scale bars in A: 1 μm; B, D: 0.1 μm; and C: 0.5 μm.
Figure 5
Figure 5
Indirect pathway striatal MSNs have higher levels of RyR labeling. Mouse brain sections were multiple immunofluorescence labeled for Kv2.1 (red) and RyR (green), and single optical sections were acquired using an epifluorescence microscope equipped with an ApoTome.. A-D: Wild type, labeling for AMIGO-1 shown in blue. In panels E-L, GFP labeling in shown in blue for E-H: EGFP-D1 transgenic mice, or I-L: EGFP-D2 transgenic mice. Scale bar in panel A is 20 μm, and is for panels A-D. Scale bars in panels E and I are 10 μm and are for panels E-H and I-L, respectively. White arrowheads indicate D1−/D2+ (indirect pathway) MSNs. Panels M-Q: Fluorescence intensities were measured from single optical sections taken at 20× using Adobe Photoshop. Cumulative percentages in panels M and N show the RyR:Kv2.1 ratios in the EGFP-D1 and EGFP-D2 mouse striatum, respectively. Panel O shows the AMIGO-1:Kv2.1 ratio in D2+ and D2− MSNs in the EGFP-D2 mouse striatum. Black lines represent D2+/D1− (indirect pathway) MSNs and gray lines represent D2−/D1+ (direct pathway) MSNs. P, Q: Average ratios RyR:Kv2.1 (black bars) and AMIGO-1:Kv2.1 (white bars) ratios from the striatum of P: EGFP-D1, and Q: EGFP-D2 mice. D1+ cell values were used to normalize for corresponding D2 measurements in each independent sample. Data are mean ± SEM (n>150 per group). *p<0.01 versus D2 measurements.
Figure 6
Figure 6
Kv2.1 phosphorylation at pS453 and pS563 and pS603 is reduced in striatum relative to cortex. Mouse brain sections obtained from an EGFP-D2 mouse were immunofluorescence labeled for Kv2.1 (magenta) and with phosphospecific antibodies specific for Kv2.1 phosphorylated at pS453 A-F, pS563 G-L or pS603 M-R (green). Images were acquired using an epifluorescence microscope equipped with an ApoTome. Images are reconstructed Z-stacks from optical sections taken at the same exposure. A-C, G-I and M-O: cortex. D-F, J-L and P-R: striatum. Scale bars are 10 μm for panels A-L, and 20 μm panels M-O.
Figure 7
Figure 7
Indirect pathway striatal MSNs have lower levels of pS563 labeling. Mouse brain sections were multiple immunofluorescence labeled for Kv2.1 and pS603, pS453 and pS563, and single optical sections acquired using an epifluorescence microscope equipped with an ApoTome. Fluorescence intensities were measured from single optical sections taken at 20x using Adobe Photoshop. Cumulative percentages in panels A, B and C show the pS453:Kv2.1, pS563:Kv2.1 and pS603:Kv2.1 ratios in the EGFP-D2 mouse striatum, respectively. Black lines represent D2+/D1− (indirect pathway) MSNs and gray lines represent D2−/D1+ (direct pathway) MSNs. D: Ratios of phosphorylation to total Kv2.1 from the striatum of EGFP-D2 mice: D2+ (black bars) and D2− (white bars). D2+ cell values were used to normalize for corresponding D2− measurements in each independent sample. Data are mean ± SEM (n>90 per group). *p<0.01 versus D2+ measurements.
Figure 8
Figure 8
Kv2.1-pS603 validation in Kv2.1-KO mice and CO2 induced dephosphorylation mouse models. Mouse brain sections from wild type mice, A-D and I-L, and Kv2.1-KO mice, E-H and M-P, were double immunofluorescence labeled for general Kv2.1 with the K89/34 mAb (red), and Kv2.1-pS603 (green), and nuclei were labeled using Hoechst (blue). Images of single optical sections of cortical neurons were acquired at equal exposures using an epifluorescence microscope equipped with an ApoTome. Kv2.1 dephosphorylation was induced using CO2 in panels I-L and M-P. Scale bars are 10 μm. Magenta lines in A and D represent line traces of fluorescence intensities depicted in the left and right graphs in panel Q. Q. Line traces were generated using the plot profile function in ImageJ for each channel.
Figure 9
Figure 9. Kv2.1-pS453 validation in Kv2.1-KO mice
Mouse brain sections from wild type mice, A-D and Kv2.1-KO mice, E-H were double immunofluorescence labeled for general Kv2.1 with the K89/34 mAb (red), and Kv2.1-pS453 (green), and nuclei were labeled using Hoechst (blue). Images of single optical sections of cortical neurons were acquired at equal exposures using an epifluorescence microscope equipped with an ApoTome. Scale bars are 10 μm.
Figure 10
Figure 10. Kv2.1-pS563 validation in Kv2.1-KO mice
Mouse brain sections from wild type mice, A-D and Kv2.1-KO mice, E-H were double immunofluorescence labeled for general Kv2.1 with the K89/34 mAb (red), and Kv2.1-pS563 (green), and nuclei were labeled using Hoechst (blue). Images of single optical sections of cortical neurons were acquired at equal exposures using an epifluorescence microscope equipped with an ApoTome. Scale bars are 10 μm.
Figure 11
Figure 11
Stimulation of RyR causes a hyperpolarizing shift in the voltage dependence of activation of Kv2.1. A: Typical current recordings of Kv2.1 alone and upon co-expression with the ryanodine receptor 1 (RyR1), ryanodine receptor 2 (RyR2) and ryanodine receptor 3 (RyR3). The voltage protocol is given on top. B-D: Conductance-voltage relationship of voltage-dependence of activation of Kv2.1 currents. Circles in all panels correspond to data from cells expressing Kv2.1 alone, before (black) and after (open) ionomycin treatment. Triangles in all panels correspond to data from cells expressing Kv2.1 with an RyR isoform (B: RyR1; C: RyR2; D: RyR3), before (black) and after (open) ryanodine treatment. The voltage-dependence of activation is derived from plotting the normalized tail current amplitudes at −35 mV as a function of the prepulse potential (ranging from 60 mV to −60 mV in 10-mV steps). Solid lines represent the Boltzmann fit. Note that the voltage dependence of activation is significantly shifted in the hyperpolarized direction upon co-expression of Kv2.1 with RyR2 even without ryanodine treatment.

References

    1. Antonucci DE, Lim ST, Vassanelli S, Trimmer JS. Dynamic localization and clustering of dendritic Kv2.1 voltage-dependent potassium channels in developing hippocampal neurons. Neuroscience. 2001;108(1):69–81. - PubMed
    1. Ariano MA, Cepeda C, Calvert CR, Flores-Hernandez J, Hernandez-Echeagaray E, Klapstein GJ, Chandler SH, Aronin N, DiFiglia M, Levine MS. Striatal potassium channel dysfunction in Huntington’s disease transgenic mice. J Neurophysiol. 2005;93(5):2565–2574. - PubMed
    1. Baek JH, Cerda O, Trimmer JS. Mass spectrometry-based phosphoproteomics reveals multisite phosphorylation on mammalian brain voltage-gated sodium and potassium channels. Semin Cell Dev Biol. 2011;22(2):153–159. - PMC - PubMed
    1. Berkefeld H, Sailer CA, Bildl W, Rohde V, Thumfart JO, Eble S, Klugbauer N, Reisinger E, Bischofberger J, Oliver D, Knaus HG, Schulte U, Fakler B. BKCa-Cav channel complexes mediate rapid and localized Ca2+-activated K+ signaling. Science. 2006;314(5799):615–620. - PubMed
    1. Berridge MJ. Neuronal calcium signaling. Neuron. 1998;21(1):13–26. - PubMed

Publication types

MeSH terms

Substances