

Natural variation in photosynthetic capacity, growth, and yield in 64 field-grown wheat genotypes
- PMID: 24963002
- PMCID: PMC4144772
- DOI: 10.1093/jxb/eru253
Natural variation in photosynthetic capacity, growth, and yield in 64 field-grown wheat genotypes
Abstract
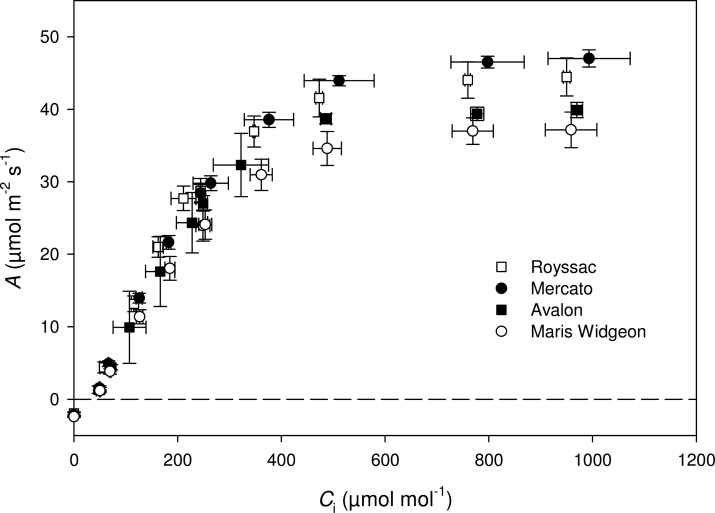
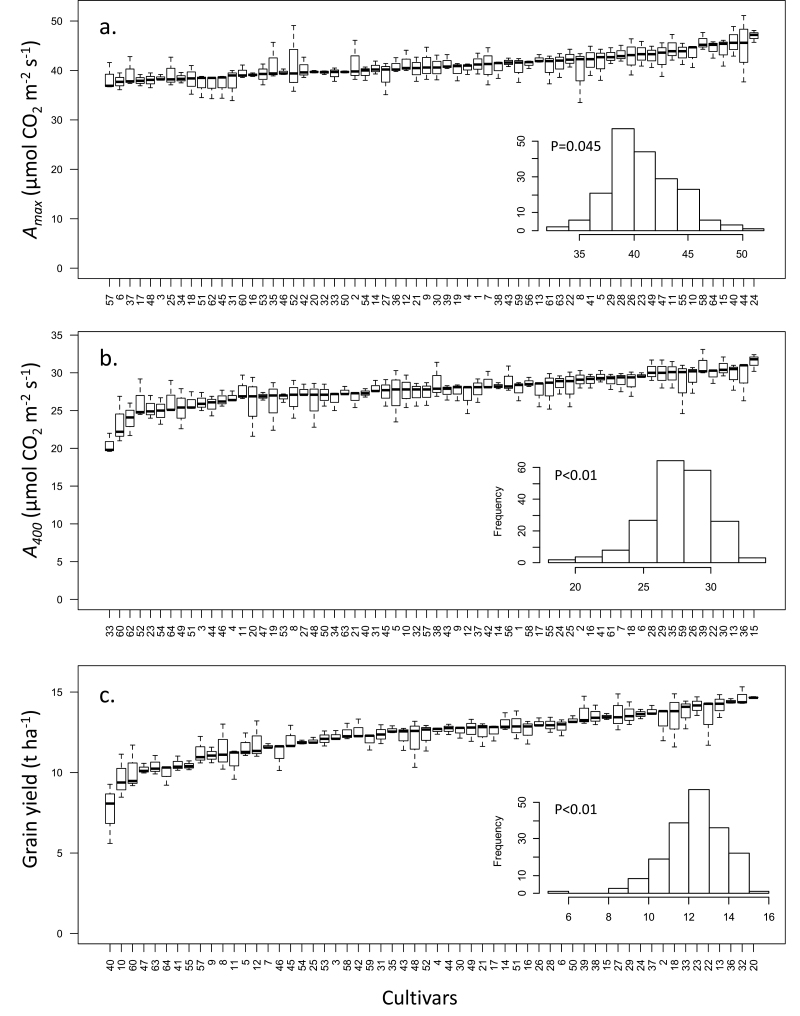
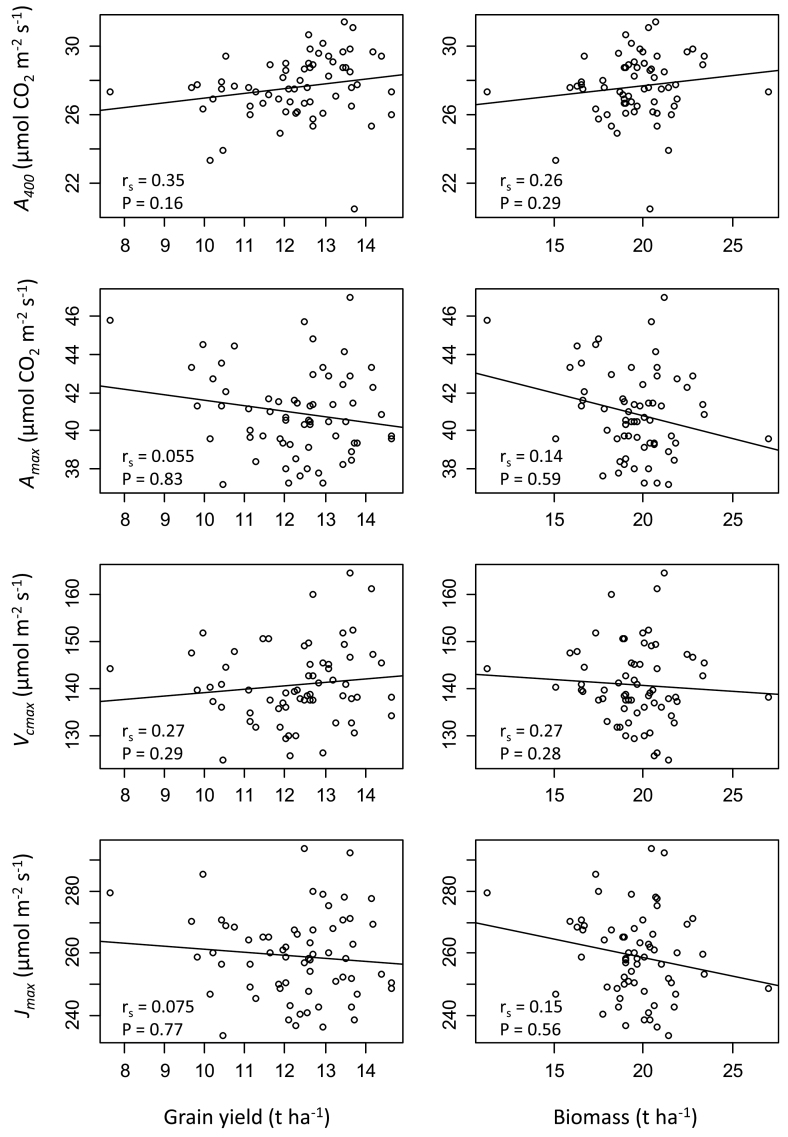
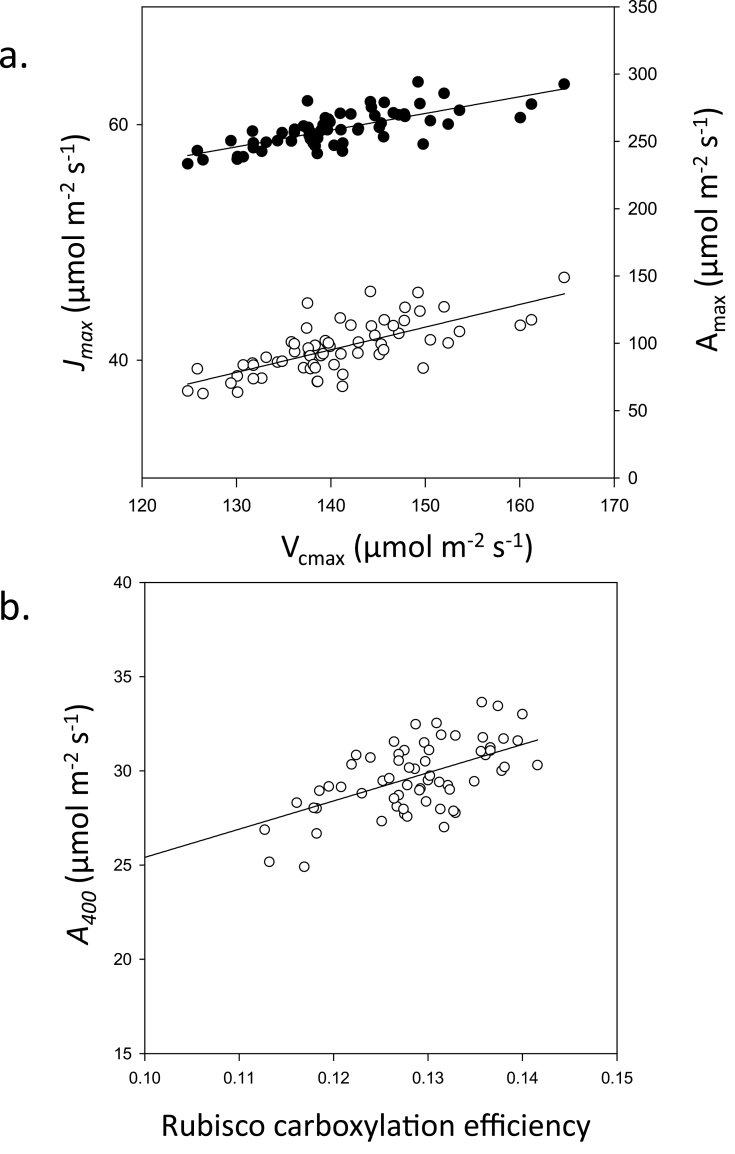
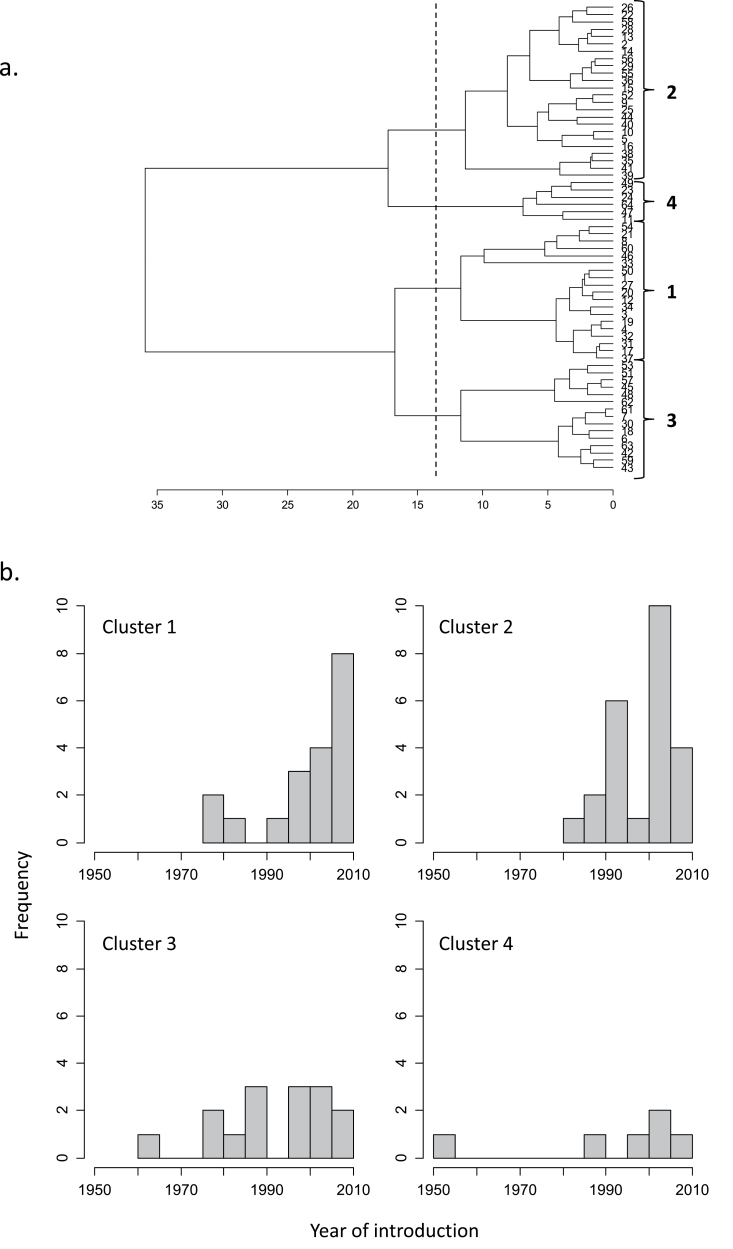
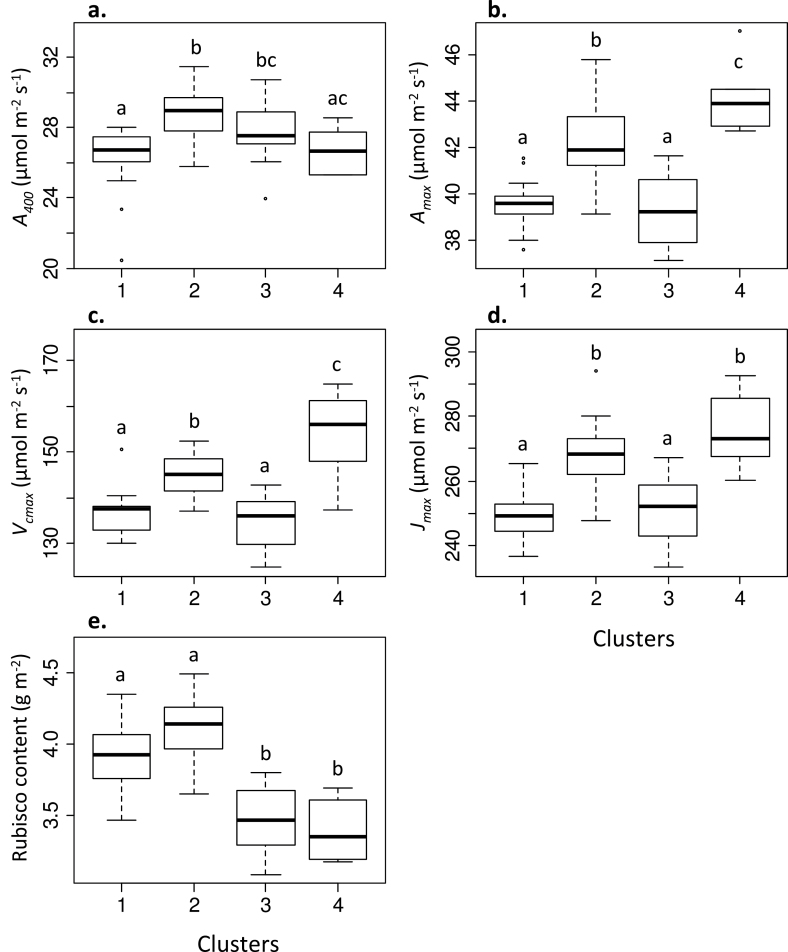
Increasing photosynthesis in wheat has been identified as an approach to enhance crop yield, with manipulation of key genes involved in electron transport and the Calvin cycle as one avenue currently being explored. However, natural variation in photosynthetic capacity is a currently unexploited genetic resource for potential crop improvement. Using gas-exchange analysis and protein analysis, the existing natural variation in photosynthetic capacity in a diverse panel of 64 elite wheat cultivars grown in the field was examined relative to growth traits, including biomass and harvest index. Significant variations in photosynthetic capacity, biomass, and yield were observed, although no consistent correlation was found between photosynthetic capacity of the flag leaf and grain yield when all cultivars were compared. The majority of the variation in photosynthesis could be explained by components related to maximum capacity and operational rates of CO2 assimilation, and to CO2 diffusion. Cluster analysis revealed that cultivars may have been bred unintentionally for desirable traits at the expense of photosynthetic capacity. These findings suggest that there is significant underutilized photosynthetic capacity among existing wheat varieties. Our observations are discussed in the context of exploiting existing natural variation in physiological processes for the improvement of photosynthesis in wheat.
Keywords: Biomass; Rubisco; natural variation; photosynthetic capacity; wheat; yield..
© The Author 2014. Published by Oxford University Press on behalf of the Society for Experimental Biology.
Figures
Similar articles
-
Phenotyping of field-grown wheat in the UK highlights contribution of light response of photosynthesis and flag leaf longevity to grain yield.J Exp Bot. 2017 Jun 15;68(13):3473-3486. doi: 10.1093/jxb/erx169. J Exp Bot. 2017. PMID: 28859373 Free PMC article.
-
Exclusion of solar UV radiation improves photosynthetic performance and yield of wheat varieties.Plant Physiol Biochem. 2015 Dec;97:400-11. doi: 10.1016/j.plaphy.2015.10.001. Epub 2015 Oct 24. Plant Physiol Biochem. 2015. PMID: 26555898
-
The Expression of TaRca2-α Gene Associated with Net Photosynthesis Rate, Biomass and Grain Yield in Bread Wheat (Triticum aestivum L.) under Field Conditions.PLoS One. 2016 Aug 22;11(8):e0161308. doi: 10.1371/journal.pone.0161308. eCollection 2016. PLoS One. 2016. PMID: 27548477 Free PMC article.
-
Raising yield potential of wheat. II. Increasing photosynthetic capacity and efficiency.J Exp Bot. 2011 Jan;62(2):453-67. doi: 10.1093/jxb/erq304. Epub 2010 Oct 27. J Exp Bot. 2011. PMID: 21030385 Review.
-
Natural genetic variation in photosynthesis: an untapped resource to increase crop yield potential?Plant J. 2020 Feb;101(3):518-528. doi: 10.1111/tpj.14568. Epub 2019 Nov 13. Plant J. 2020. PMID: 31625637 Free PMC article. Review.
Cited by
-
Natural Variation in Elicitation of Defense-Signaling Associates to Field Resistance Against the Spot Blotch Disease in Bread Wheat (Triticum aestivum L.).Front Plant Sci. 2018 May 16;9:636. doi: 10.3389/fpls.2018.00636. eCollection 2018. Front Plant Sci. 2018. PMID: 29868089 Free PMC article.
-
Wheat Grain Filling Is Limited by Grain Filling Capacity rather than the Duration of Flag Leaf Photosynthesis: A Case Study Using NAM RNAi Plants.PLoS One. 2015 Aug 4;10(8):e0134947. doi: 10.1371/journal.pone.0134947. eCollection 2015. PLoS One. 2015. PMID: 26241955 Free PMC article.
-
A guide to understanding and measuring photosynthetic induction: considerations and recommendations.New Phytol. 2025 Jul;247(2):450-469. doi: 10.1111/nph.70218. Epub 2025 Jun 1. New Phytol. 2025. PMID: 40452130 Free PMC article. Review.
-
Phenotyping for Drought Tolerance in Different Wheat Genotypes Using Spectral and Fluorescence Sensors.Plants (Basel). 2025 Jul 17;14(14):2216. doi: 10.3390/plants14142216. Plants (Basel). 2025. PMID: 40733453 Free PMC article.
-
Uncovering candidate genes involved in photosynthetic capacity using unexplored genetic variation in Spring Wheat.Plant Biotechnol J. 2021 Aug;19(8):1537-1552. doi: 10.1111/pbi.13568. Epub 2021 Feb 27. Plant Biotechnol J. 2021. PMID: 33638599 Free PMC article.
References
-
- Ainsworth EA, Long SP. 2005. What have we learned from 15 years of free-air CO2 enrichment (FACE)? A meta-analytic review of the responses of photosynthesis, canopy. New Phytologist 165, 351–371 - PubMed
-
- Blum A. 1990. Variation among wheat cultivars in the response of leaf gas-exchange to light. Journal of Agricultural Science 115, 305–311
-
- Bradford MM. 1976. A rapid and sensitive method for the quantitation of microgram quantities of protein utilizing the principle of protein-dye binding. Analytical Biochemistry 72, 248–254 - PubMed
-
- Braun HJ, Atlin G, Payne T. 2010. Multi-location testing as a tool to identify plant response to global climate change. In: Reynolds MP, ed. Climate change and crop production. Surrey, UK: CABI Climate Change Series, 115–138
Publication types
MeSH terms
Substances
Grants and funding
LinkOut - more resources
Full Text Sources
Other Literature Sources
