. 2014 Sep 1;20(17):4584-97.
doi: 10.1158/1078-0432.CCR-14-0072. Epub 2014 Jun 24.

Reversible LSD1 inhibition interferes with global EWS/ETS transcriptional activity and impedes Ewing sarcoma tumor growth

Affiliations

Reversible LSD1 inhibition interferes with global EWS/ETS transcriptional activity and impedes Ewing sarcoma tumor growth

Savita Sankar et al. Clin Cancer Res. .

Abstract

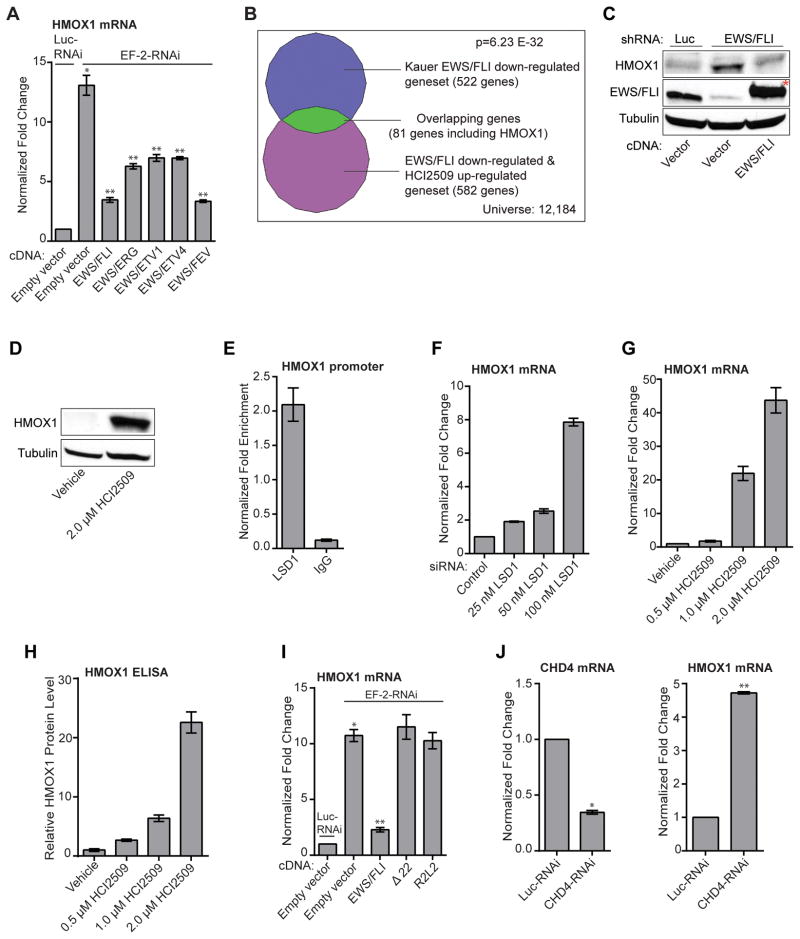
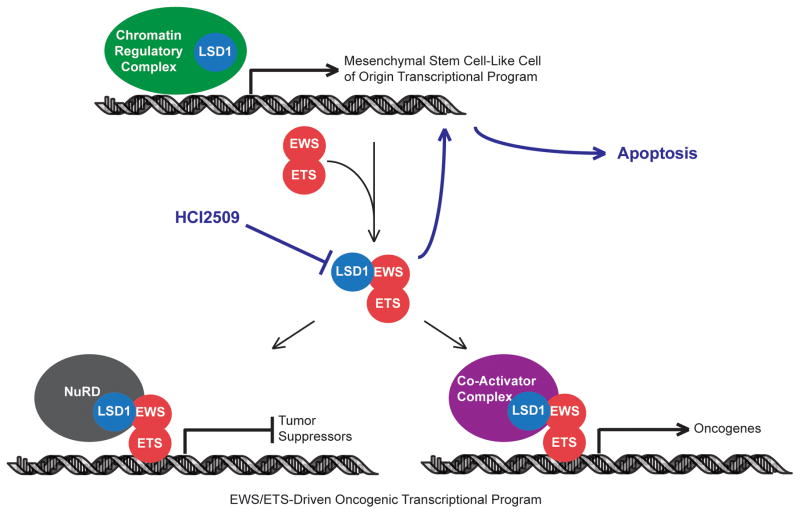
Purpose: Ewing sarcoma is a pediatric bone tumor that absolutely relies on the transcriptional activity of the EWS/ETS family of fusion oncoproteins. While the most common fusion, EWS/FLI, utilizes lysine-specific demethylase 1 (LSD1) to repress critical tumor suppressors, small-molecule blockade of LSD1 has not yet been thoroughly explored as a therapeutic approach for Ewing sarcoma. We therefore evaluated the translational potential of potent and specific LSD1 inhibition with HCI2509 on the transcriptional program of both EWS/FLI and EWS/ERG as well as the downstream oncogenic phenotypes driven by EWS/ETS fusions in both in vitro and in vivo models of Ewing sarcoma.

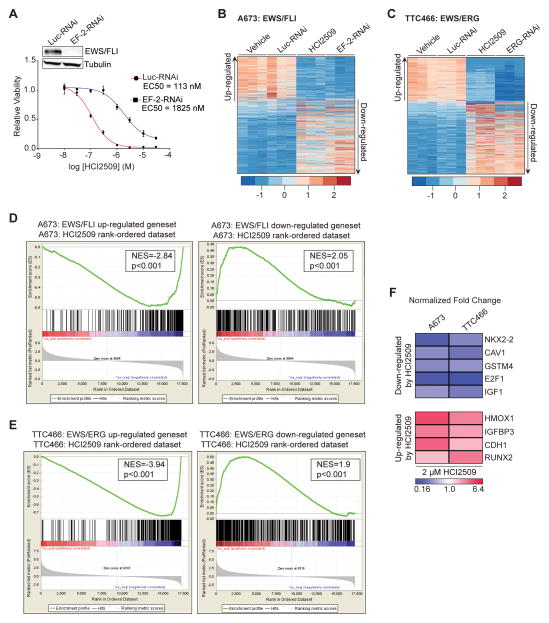
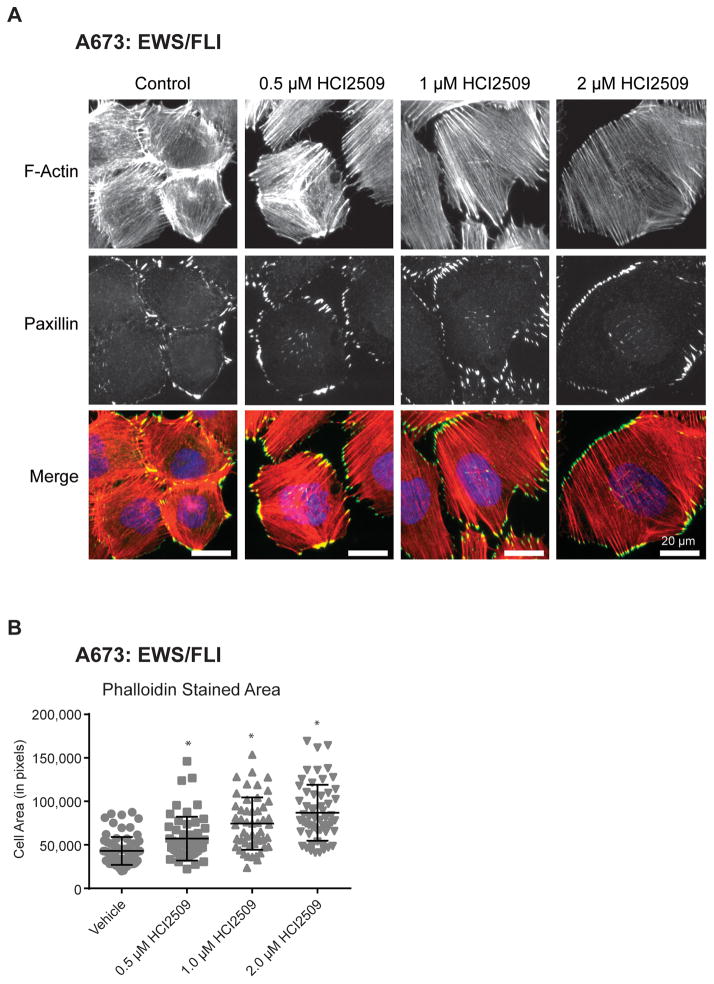
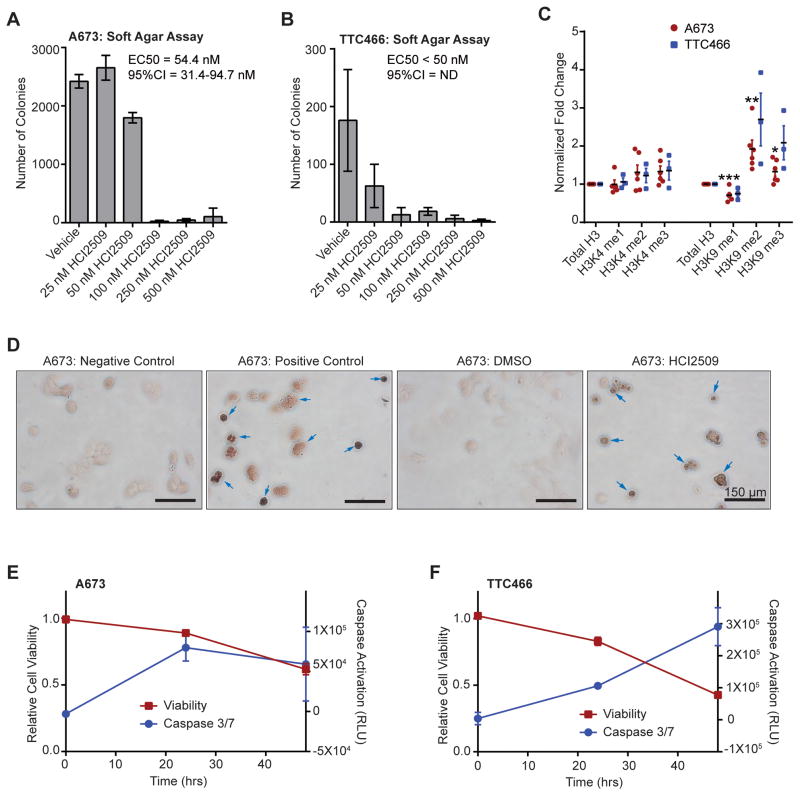
Experimental design: RNA-seq was used to compare the transcriptional profiles of EWS/FLI, EWS/ERG, and treatment with HCI2509 in both EWS/FLI- and EWS/ERG-containing cell lines. We then evaluated morphologic phenotypes of treated cells with immunofluorescence. The induction of apoptosis was evaluated using caspase-3/7 activation and TUNEL staining. Colony forming assays were used to test oncogenic transformation and xenograft studies with patient-derived cell lines were used to evaluate the effects of HCI2509 on tumorigenesis.

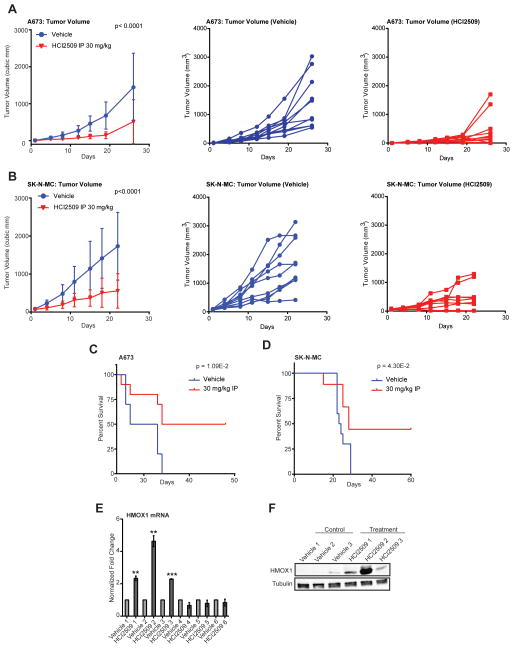
Results: HCI2509 caused a dramatic reversal of both the up- and downregulated transcriptional profiles of EWS/FLI and EWS/ERG accompanied by the induction of apoptosis and disruption of morphologic and oncogenic phenotypes modulated by EWS/FLI. Importantly, HCI2509 displayed single-agent efficacy in multiple xenograft models.

Conclusions: These data support epigenetic modulation with HCI2509 as a therapeutic strategy for Ewing sarcoma, and highlight a critical dual role for LSD1 in the oncogenic transcriptional activity of EWS/ETS proteins.


Conflict of interest statement

Competing interests: S.L.L is on the scientific advisory board for and S.Sh. is a founder and Chief Medical Officer of Salarius Pharmaceuticals, a company focused on epigenetic therapies for cancer.

Figures

Figure 1
Figure 1. Global EWS/FLI transcriptional activity is disrupted by HCI2509
A) Cell viability assay showing the difference in HCI2509 sensitivity between A673 cells with control (EC50=113 nM; 95% CI 81.9–158 nM) and EWS/FLI knockdown (EC50=1825 nM; 95%–CI 1111–2999 nM). The dose-response curves were determined after 96 hours of treatment and normalized to the vehicle controls. Mean and SD are shown (n=3). Stable EWS/FLI knockdown was analyzed by Western Blot as shown in the inset. B,C) Heat map representation of the HCI2509 expression profile matched to the rank-ordered (B) EWS/FLI- and (C) EWS/ERG-knockdown profiles. Genes were ranked by mean deviation of the log transformed FPKM (Fragments Per Kilobase per Million mapped reads). The columns for each condition represent one independent biological replicate. Each row represents a different gene. D,E) Gene set enrichment analysis (GSEA) from RNA-seq experiments using (D) the EWS/FLI regulated genes in A673 cells as the rank-ordered dataset and the 281 HCI2509 up-regulated and 376 HCI2509-down-regulated genes as the genesets and (E) EWS/ERG regulated genes in TTC-466 cells as the rank-ordered dataset and the 216 HCI2509 up-regulated and 357 HCI2509-down-regulated genes as the genesets. Normalized enrichment scores (NES) and P values are shown. F) qRT-PCR validation of NKX2.2, CAV1, GSTM4, E2F1, IGF-1, RUNX2, IGFBP3, HMOX1 and CDH1 as HCI2509 targets in A673 and TTC-466 cells treated for 48 hours with vehicle or HCI2509 at 2xEC50. Normalized fold change is indicated as a heat map. The p-value for each fold-change is < 0.05 (n=3). Individual p-values are reported in Supplementary Table S2.
Figure 2
Figure 2. Morphological Changes in A673 with HCI2509 Treatment
A) Immunofluorescence images of A673 cells treated with increasing doses of HCI2509 for 3 days. Staining was performed for F-actin stress fibers (red – phalloidin) and for focal adhesions (green – paxillin), and nuclei (blue). HCI2509 induced a dose-dependent increase in the cell spreading and morphology. B) Cell area in pixels shows a dose-dependent increase in cell spreading with increasing doses of HCI2509. A673 cells were fixed and stained with phalloidin. Cell area was quantified as previously described (39). Data is plotted as mean with sd and p-values were calculated using a Student’s t-test(* p<0.0001.)
Figure 3
Figure 3. Mechanism of action of HCI2509 in vitro
A,B) Quantification of colonies formed by (A) A673 cells and (B) TTC-466 cells treated with either vehicle (0.3% DMSO) or increasing doses of HCI2509. Error bars indicate SD of duplicate assays. EC50 values were determined using GraphPad Prism 6. C) Quantification of global methylation changes at histone H3K4 and H3K9 in A673 (red, n=5) and TTC-466 (blue, n=3) following 48-hr treatment with 2 μM HCI2509. Methyl marks were assayed by western blot and the relative band intensities were quantified using ImageQuant (GE Healthcare Biosciences). Each sample was normalized to total H3 and fold-change was determined by comparison to a vehicle control. Error bars indicate SEM and p values were calculated using a Student’s t-test (*p=4.25E-2, **p=1.07E-2, ***p=6.36E-3). D) TUNEL staining of A673 cells treated with either vehicle (0.3% DMSO) or 2 μM HCI2509. Negative control indicates lack of labeling and positive control indicates DNase treatment with labeling. Arrows indicated TUNEL-positive cells. E,F) Cell viability and caspase activation at 0, 24, and 48 hours in (E) A673 and (F) TTC-466 cells treated with 2 μM HCI2509. Measurements were normalized to their respective vehicle (0.3% DMSO) sample at the appropriate time point.
Figure 4
Figure 4. Regulation of HMOX1
A) Validation of HMOX1 as a target gene of multiple EWS/ETS fusion. qRT-PCR analysis of HMOX1 in A673 cells infected with a control shRNA (Luc) or an EWS/FLI shRNA followed by rescue with an empty vector, an RNAi-resistant EWS/FLI, EWS/ETV1, EWS/ERG, EWS/ETV4, or EWS/FEV cDNA. Error bars indicate SD (n=3). P values were calculated using Student’s t-test. *P value determined against Luc-RNAi/Empty vector (p=1.51E-5). **P values determined against EF-2-RNAi/Empty vector (p≤2.79E-4). B) Venn diagram representation of the HCI2509-up-regulated and EWS/FLI-down-regulated geneset (from Figure S1E) overlapped with EWS/FLI down-regulated targets in primary tissue samples. The chi square-determined P value is indicated. C,D) Western blot analysis of HMOX1 protein levels with (B) EWS/FLI knockdown/rescue and (C) HCI2509 treatment. HMOX1 and EWS/FLI levels were assessed in A673 cells using anti-HMOX1 and anti-FLI antibodies. Tubulin was used as a loading control. (*) indicates the 3x-FLAG tagged EWS/FLI cDNA that runs slightly higher than endogenous EWS/FLI. E) ChIP of LSD1 with the level of enrichment for LSD1 at the HMOX1 transcription start site plotted as normalized fold enrichment compared to the enrichment at BCL2L1 as a negative control. IgG was used as a negative antibody control. The error bars indicate SEM (n=3). The Student’s t-test determined P value is 1.10E-3. F,G,H,I,J) Validation of HMOX1 repression as on target. P values were calculated using a Student’s t-test. qRT-PCR analysis of HMOX1 in A673 cells treated with: (F) vehicle, 25 nM (p=1.43E-5), 50 nM (p=3.05E-4), and 100 nM LSD1 siRNA (p=7.39E-6) and (G) vehicle, 0.5 uM (p=3.65E-2), 1 uM (5.82E-4), and 2 uM HCI2509 (3.48E-4). (H) Quantification of protein levels by ELISA for A673 cells treated with vehicle, 0.5 uM (p=6E-4), 1 uM (p=1E-4), and 2 uM HCI2509 (p=1E-4). (I) qRT-PCR analysis of HMOX1 in A673 cells treated with (I) knockdown of EWS/FLI and rescue with full-length, Δ22, and R2L2 mutants. *P value determined against Luc-RNAi/Empty vector (P=1.32E-6). **P value determined against EF-2-RNAi/Empty vector (p=3.99E-6). (J) qRT-PCR analysis of both CHD4 and HMOX1 mRNA in the presence of control or CHD4 RNAi. *p=2.95E-7 **p=3.98E-9. Error bars indicate SD (n=3).
Figure 5
Figure 5. HCI2509 activity in vivo
A,B) In vivo subcutaneous hind-flank xenograft studies measuring tumor volume for animals bearing tumors grown from (A) A673 cells and (B) SK-N-MC cells. N=10 for all groups, with the exception of SK-N-MC HCI2509 treated group as noted. For tumor volumes, P-values were determined by 2-way ANOVA comparing the treatment curve to the vehicle curve. Individual tumor growth curves are shown for the vehicle-treated (blue) and HCI2509-treated (red) groups. C,D) Survival curves for mice bearing subcutaneous hind-flank xenografts of (C) A673 cells or (D) SK-N-MC cells. N=10 for the A673 group. In the SK-N-MC treatment group one mouse died due to a treatment-unrelated rash and was censored from further analysis. Therefore, in the SK-N-MC study 10 and 9 mice were used for the vehicle and HCI2509 treatment groups, respectively. The mice were sacrificed once their tumors reached a size limit of 2 cm3. Percent survival was plotted as Kaplan-Meier survival curves using GraphPad Prism. The log-rank (Mantel-Cox Test) determined P values using GraphPad Prism are indicated. E,F) Analysis of HMOX1 expression by (E) qRT-PCR and (F) western blot in tumors from both vehicle and treatment A673 groups. Only the three tumors which showed an increase in HMOX1 RNA (E) were used for western blotting with three random vehicle tumors (F). HMOX1 levels were assessed using an anti-HMOX1 antibody. Tubulin was used as a loading control. Error bars indicate SD (*for p<0.01; **for p<0.001).
Figure 6
Figure 6. Model for HCI2509 mechanism of action in Ewing sarcoma
HCI2509 treatment inhibits LSD1, which impairs the ability of EWS/ETS fusions proteins to globally alter gene expression. This leads, in part, to a reversion to the transcriptional program of the putative cell-of-origin and causes apoptosis.

References

    1. Dawson MA, Kouzarides T. Cancer epigenetics: from mechanism to therapy. Cell. 2012;150:12–27. - PubMed
    1. Sharma S, Kelly TK, Jones PA. Epigenetics in cancer. Carcinogenesis. 2010;31:27–36. - PMC - PubMed
    1. Lachner M, O’Sullivan RJ, Jenuwein T. An epigenetic road map for histone lysine methylation. J Cell Sci. 2003;116:2117–24. - PubMed
    1. Stresemann C, Lyko F. Modes of action of the DNA methyltransferase inhibitors azacytidine and decitabine. Int J Cancer. 2008;123:8–13. - PubMed
    1. Choudhary C, Kumar C, Gnad F, Nielsen ML, Rehman M, Walther TC, et al. Lysine acetylation targets protein complexes and co-regulates major cellular functions. Science. 2009;325:834–40. - PubMed

Publication types

MeSH terms