. 2014 Aug;6(8):1062-74.
doi: 10.15252/emmm.201403856.

A positive feedback loop between RIP3 and JNK controls non-alcoholic steatohepatitis

Affiliations

A positive feedback loop between RIP3 and JNK controls non-alcoholic steatohepatitis

Jérémie Gautheron et al. EMBO Mol Med. 2014 Aug.

Abstract

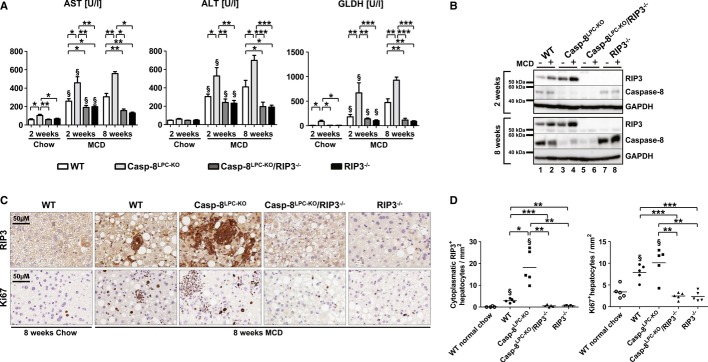
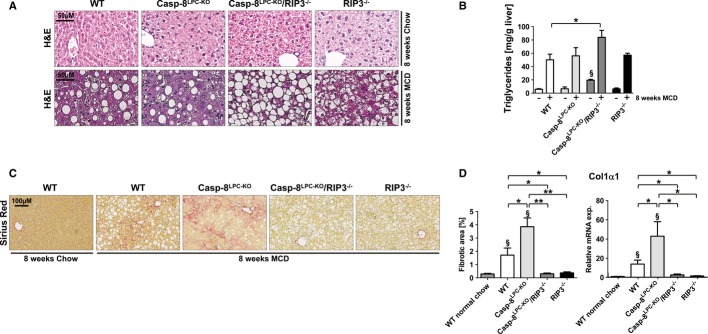
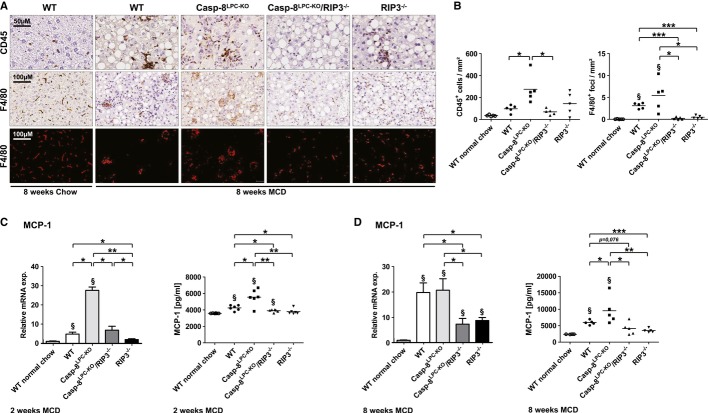
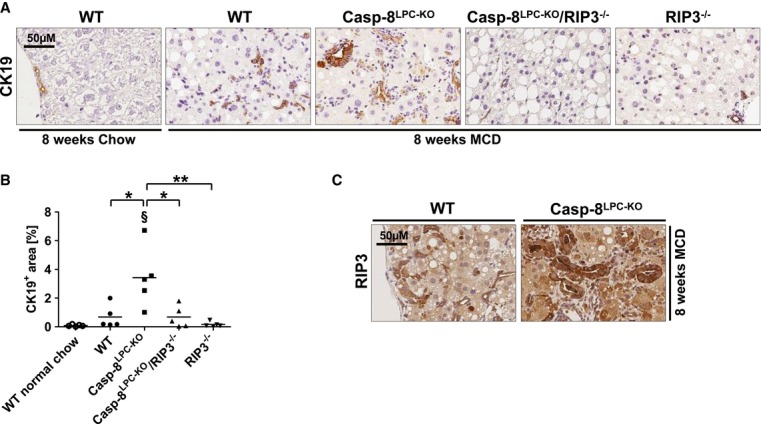
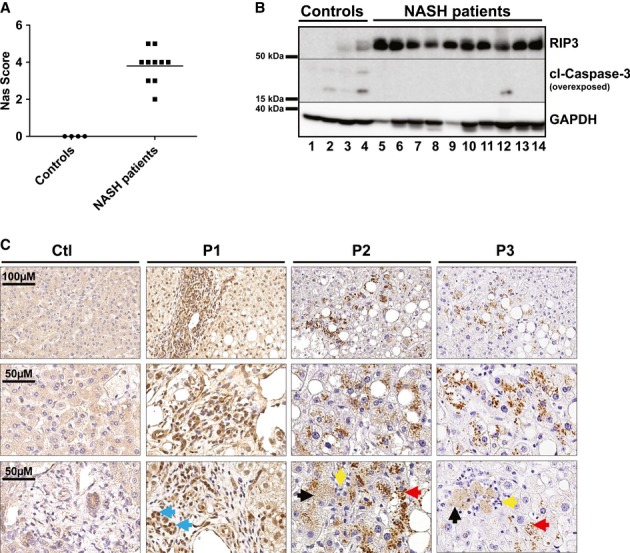
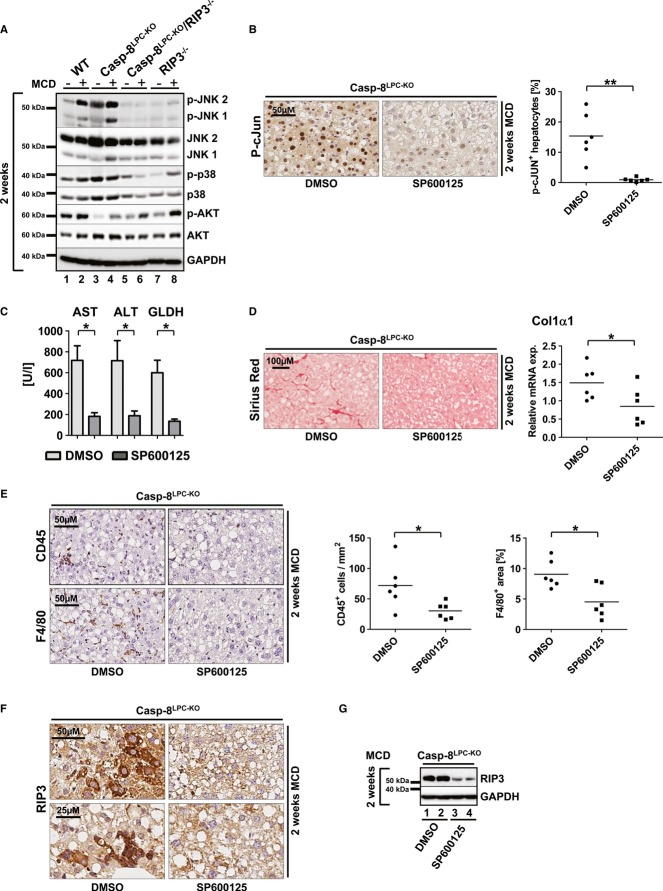
Non-alcoholic fatty liver disease (NAFLD) represents the most common liver disease in Western countries and often progresses to non-alcoholic steatohepatitis (NASH) leading ultimately to liver fibrosis and liver cancer. The occurrence of hepatocyte cell death-so far characterized as hepatocyte apoptosis-represents a fundamental step from benign steatosis toward progressive steatohepatitis. In contrast, the function of RIP3-dependent "necroptosis" in NASH and NASH-induced fibrosis is currently unknown. We show that RIP3 is upregulated in human NASH and in a dietary mouse model of steatohepatitis. RIP3 mediates liver injury, inflammation, induction of hepatic progenitor cells/activated cholangiocytes, and liver fibrosis through a pathway suppressed by Caspase-8. This function of RIP3 is mediated by a positive feedback loop involving activation of Jun-(N)-terminal Kinase (JNK). Furthermore, RIP3-dependent JNK activation promotes the release of pro-inflammatory mediators like MCP-1, thereby attracting macrophages to the injured liver and further augmenting RIP3-dependent signaling, cell death, and liver fibrosis. Thus, RIP3-dependent necroptosis controls NASH-induced liver fibrosis. This pathway might represent a novel and specific target for pharmacological strategies in patients with NASH.

Keywords: Caspase‐8; MCP‐1; biliary ductular reaction; liver fibrosis; necroptosis.


Figures

Figure 1
Figure 1. RIP3 is induced in murine livers following MCD-diet feeding and promotes hepatic injury in Caspase-8-deficient livers
A   Analysis of serum levels of AST, ALT, and GLDH after 2 and 8 weeks of MCD-diet or 2 weeks of normal chow. Results are shown as mean ± SEM, n = 6 (2 weeks normal chow) n = 12 (2 weeks MCD), and n = 5 (8 weeks MCD). §indicates that serum levels are significantly increased from basal level. B   Western blots analysis on liver extracts from MCD-diet-fed (2- and 8-weeks) animals and control mice with antibodies against RIP3, Caspase-8, and GAPDH as a loading control. C   Immunohistochemical (RIP3, Ki67) analysis on representative liver sections from the indicated mice fed for 8 weeks with MCD-diet. D   Statistical analysis of RIP3+ and Ki67+ hepatocytes. Results are shown as mean, n = 5. §indicates that RIP3+ and Ki67+ cells are significantly increased from basal WT group. Data information: The exact P-values of each experiment and specific tests used are provided in the Supplementary Table S1. Source data is available online for this figure.
Figure 2
Figure 2. RIP3-dependent necroptosis promotes NASH-induced liver fibrosis and inflammation
A   Representative H&E staining of liver slides from 16-week-old WT, Casp-8LPC-KO, Casp-8LPC-KO/RIP3−/−, and RIP3−/− mice fed for 8 weeks with normal chow (upper panel) or MCD-diet (lower panel). B   Intrahepatic triglycerides levels in WT, Casp-8LPC-KO, Casp-8LPC-KO/RIP3−/−, and RIP3−/− fed for 8 weeks with MCD-diet or control chow, results are shown as mean ± SEM, n = 5 per group. §indicates that triglycerides are significantly increased from Casp-8LPC-KO/RIP3−/− to the others groups of mice fed with normal chow. C   Representative Sirius Red stainings of liver slides from 8-week-old female WT, Casp-8LPC-KO, Casp-8LPC-KO/RIP3−/−, and RIP3−/− mice fed for 8 weeks with MCD-diet. D   Left: statistical quantification of light polarized Sirius Red pictures, results are shown as mean, n = 5 per group. Right: Col1α1 mRNA levels in these livers were determined by qRT-PCR. Values were calculated relative to WT mice fed with normal show, and β-catenin was used as an internal standard, n = 5 per group. §indicates that values are significantly increased from basal level. Error bars represent SEM. Data information: The exact P-values of each experiment and specific tests used are provided in the Supplementary Table S1.
Figure 3
Figure 3. RIP3-dependent necroptosis promotes NASH-induced liver fibrosis through MCP-1 release
A   Immunohistochemical analysis of CD45 (upper panel) and F4/80 (middle panel) on representative liver sections from the indicated mice fed for 8-weeks with MCD-diet or normal chow. The lower panel shows deconvoluted pictures from the F4/80 stains. B   Statistical analysis of CD45+ and F4/80+ cells. Results are shown as mean, n = 5. §indicates that F4/80+ foci are significantly increased from basal WT group. C   Left: MCP-1 mRNA levels were assessed by RT-PCR after 2 weeks of MCD-diet feeding. Values were calculated relative to WT mice fed with normal chow, and β-catenin was used as an internal standard, n = 6 per group. Right: FACS-based microbeads fluorescence assay for MCP-1 expression in liver protein homogenates. Results are shown as mean, n = 6 per group. § shows that values are significantly increased from basal level. Error bars indicate SEM. D   Left: MCP-1 mRNA levels were assessed by RT-PCR after 8 weeks of MCD-diet feeding. Values were calculated relative to WT mice fed with normal chow, and β-catenin was used as an internal standard, n = 5 per group. §indicates that values are significantly increased from basal level. Error bars represent SEM. Right: FACS-based microbeads fluorescence assay for MCP-1 expression in liver protein homogenates. Results are shown as mean, n = 5 per group. §shows that values are significantly increased from basal level. Error bars indicate SEM. Data information: The exact P-values of each experiment and specific tests used are provided in the Supplementary Table S1.
Figure 4
Figure 4. RIP3-dependent necroptosis mediates expansion of progenitor cells that expressed high levels of RIP3
A   Immunohistochemical (CK19) analysis on representative liver sections from the indicated mice fed for 8-weeks with MCD-diet. B   Statistical analysis of CK19+ cells. Results are shown as mean, n = 5. §shows that CK19+ cells are significantly increased from basal WT group. C   Immunohistochemical (RIP3) analysis on representative liver sections from WT and Casp-8LPC-KO mice fed for 8 weeks with MCD-diet. Data information: The exact P-values of each experiment and specific tests used are provided in the Supplementary Table S1.
Figure 5
Figure 5. RIP3 is overexpressed in livers of human NASH patients
A   Western blot analysis of RIP3 in control livers (n = 4) and human NASH patients (n = 10), using antibodies against RIP3, cleaved Caspase-3, and GAPDH as a loading control. B   NAS scores of control livers and human NASH samples, corresponding to the Western blot analysis for RIP3. C   Immunostaining analyses of RIP3 in control livers and human NASH patients (P1, P2, P3) (blue arrows indicate progenitor/biliary cells, black arrows indicate necrotic hepatocytes, red arrows show clusters of RIP3 in hepatocytes, and yellow arrows indicate inflammatory cells grouped around dying hepatocytes). Pictures are representative for 27 samples examined. Source data are available online for this figure.
Figure 6
Figure 6. RIP3 mediates MCD-diet-induced NASH and liver fibrosis through activation of Jun-(N)-terminal kinase (JNK)
A   Western blot analysis of whole liver protein extracts from WT, Casp-8LPC-KO, Casp-8LPC-KO/RIP3−/−, and RIP3−/− mice fed with MCD-diet for 14 days, using antibodies against the phosphorylated and active forms of JNK, AKT, p38 and GAPDH, JNK, AKT, and p38 as loading controls. B   Immunohistochemical (left) and statistical analysis (right) of nuclear p-c-Jun+ hepatocytes on representative liver sections from Casp-8LPC-KO mice treated with SP600125 or vehicle (DMSO) for 2 weeks under MCD-diet, n = 6 per group. C   Analysis of serum levels of AST, ALT, and GLDH of vehicle-treated and SP600125-treated mice after 2 weeks of MCD-diet feeding. Results are shown as mean ± SEM, n = 6 per group. D   Left: representative Sirius Red stainings of mice treated with vehicle substance (DMSO) or SP600125 for 2 weeks. Right: Col1α1 mRNA levels quantification by qRT-PCR, n = 6 per group. Error bars represent SEM. E   Immunohistochemical (left) and statistical analysis (right) of CD45+ and F4/80+ cells on representative liver sections from Casp-8LPC-KO mice treated with SP600125 or vehicle (DMSO) for 2 weeks with MCD-diet, n = 6 per group. F   Immunostaining analysis of RIP3 in Casp-8LPC-KO mice treated with SP600125 or vehicle (DMSO) for 2 weeks with MCD-diet. G   Western blot analysis of RIP3 in Casp-8LPC-KO mice treated with SP600125 or vehicle (DMSO) for 2 weeks with MCD-diet. Data information: The exact P-values of each experiment and specific tests used are provided in the Supplementary Table S1. Source data are available online for this figure.

References

    1. Anstee QM, Concas D, Kudo H, Levene A, Pollard J, Charlton P, Thomas HC, Thursz MR, Goldin RD. Impact of pan-caspase inhibition in animal models of established steatosis and non-alcoholic steatohepatitis. J Hepatol. 2010;53:542–550. - PubMed
    1. Baeck C, Wehr A, Karlmark KR, Heymann F, Vucur M, Gassler N, Huss S, Klussmann S, Eulberg D, Luedde T, et al. Pharmacological inhibition of the chemokine CCL2 (MCP-1) diminishes liver macrophage infiltration and steatohepatitis in chronic hepatic injury. Gut. 2012;61:416–426. - PubMed
    1. Bhala N, Angulo P, van der Poorten D, Lee E, Hui JM, Saracco G, Adams LA, Charatcharoenwitthaya P, Topping JH, Bugianesi E, et al. The natural history of nonalcoholic fatty liver disease with advanced fibrosis or cirrhosis: an international collaborative study. Hepatology. 2011;54:1208–1216. - PMC - PubMed
    1. Bonnet MC, Preukschat D, Welz PS, van Loo G, Ermolaeva MA, Bloch W, Haase I, Pasparakis M. The adaptor protein FADD protects epidermal keratinocytes from necroptosis in vivo and prevents skin inflammation. Immunity. 2011;35:572–582. - PubMed
    1. Chakraborty JB, Oakley F, Walsh MJ. Mechanisms and biomarkers of apoptosis in liver disease and fibrosis. Int J Hepatol. 2012;2012:648915. - PMC - PubMed

Publication types