

Review
doi: 10.1055/s-0034-1381733.
Epub 2014 Jun 25.
The utility of neuroimaging in the differential diagnosis of parkinsonian syndromes
Affiliations
- PMID: 24963679
- PMCID: PMC4556352
- DOI: 10.1055/s-0034-1381733
Item in Clipboard
Review
The utility of neuroimaging in the differential diagnosis of parkinsonian syndromes
Semin Neurol.
2014 Apr.
Abstract
The differential diagnosis of parkinsonian syndromes can be challenging, particularly in early disease stages. However, prognosis and therapeutic regimes are not alike in Parkinson disease and atypical parkinsonism, and thus a correct diagnosis at the earliest possible stage is desirable. Over the past two decades, magnetic resonance imaging and radiotracer-based imaging techniques have proven to be helpful tools to enhance the accuracy of clinical diagnosis in these disorders. Here, we review recent advances in neuroimaging for the differential diagnosis of parkinsonian syndromes.
Thieme Medical Publishers 333 Seventh Avenue, New York, NY 10001, USA.
Figures
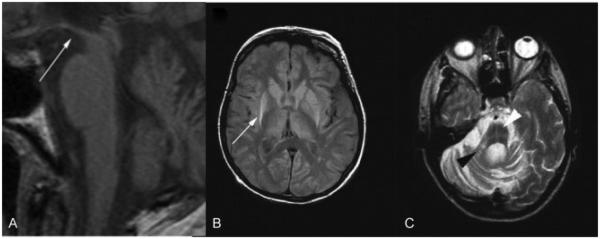
Structural magnetic resonance imaging in progressive supranuclear palsy (PSP) and multiple system atrophy (MSA). (A) T1-weighted image showing hummingbird sign (white arrow) in PSP 1.5 years after onset. (B) Proton density weighted image of pathologically confirmed MSA. Putaminal atrophy with hyperintense putaminal rim (white arrow) on the right and early hyperintense putaminal rim on the left 4.8 years after disease onset. (C) Right middle cerebellar peduncle sign (black arrowhead) and hot cross bun sign (white arrowhead) in pathologically confirmed MSA (T2-weighted image). (Adapted with permission from Massey et al. Conventional Magnetic Resonance Imaging in Confirmed Progressive Supranuclear Palsy and Multiple System Atrophy. Mov Disord 2012; 27:1754–1762.)
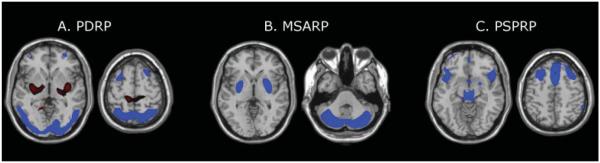
Disease-related spatial covariance patterns. (A) Parkinson disease-related pattern (PDRP) identified by spatial covariance analysis of 18F-fluorodeoxyglucose positron emission tomography (FDG PET) scans from 33 patients with Parkinson disease and 33 age-matched normal volunteer subjects. This pattern was characterized by relative metabolic increases (red) in the pallidum and thalamus, in the pons and cerebellum, and in the sensorimotor cortex. These changes covaried with metabolic decreases (blue) in the lateral premotor cortex and in parieto-occipital association regions. (Adapted from Ma et al. Abnormal metabolic network activity in Parkinson’s disease: test-rest reproducibility. J Cereb Blood Flow Metab 2007;27:597–605.) (B) Multiple system atrophy-related pattern (MSARP) identified by spatial covariance analysis of FDG PET scans from 10 patients with multiple system atrophy and 10 healthy controls. This pattern was characterized by covarying metabolic decreases (blue) in the putamen and the cerebellum. (Adapted with permission from Eckert et al. Abnormal Metabolic Networks in Atypical Parkinsonism. Mov Disord 2008;23:727–733.) (C) Progressive supranuclear palsy-related pattern (PSPRP) identified by spatial covariance analysis of FDG PET scans from 10 patients with progressive supranuclear palsy and 10 healthy controls. This pattern was characterized by covarying metabolic decreases (blue) in the medial prefrontal cortex, the frontal eye fields, the ventrolateral prefrontal cortex, the caudate nuclei, the medial thalamus, and the upper brainstem. (Adapted with permission from Eckert et al. Abnormal Metabolic Networks in Atypical Parkinsonism. Mov Disord 2008;23:727–733.) (The covariance maps were overlaid on T1-weighted magnetic resonance-template images. Voxels with positive region weights [metabolic increases] are color-coded red and those with negative region weights [metabolic decreases] are color-coded blue.)
Similar articles
-
[Differential diagnosis of atypical Parkinsonian syndromes].Ideggyogy Sz. 2010 Mar 30;63(3-4):77-86. Ideggyogy Sz. 2010. PMID: 20405664 Review. Hungarian.
-
Imagerie cérébrale dans les syndromes parkinsoniens.Presse Med. 2017 Mar;46(2 Pt 1):202-209. doi: 10.1016/j.lpm.2016.09.025. Epub 2016 Dec 28. Presse Med. 2017. PMID: 28040345 French.
-
Brain magnetic resonance imaging techniques in the diagnosis of parkinsonian syndromes.Neuroimaging Clin N Am. 2010 Feb;20(1):29-55. doi: 10.1016/j.nic.2009.08.016. Neuroimaging Clin N Am. 2010. PMID: 19959017 Review.
-
Neuroimaging of Parkinson's disease and atypical parkinsonism.Curr Neurol Neurosci Rep. 2004 Jul;4(4):284-9. doi: 10.1007/s11910-004-0053-1. Curr Neurol Neurosci Rep. 2004. PMID: 15217542 Review.
-
A differential diagnosis of Parkinsonism.Rev Neurol Dis. 2005 Summer;2(3):124-31. Rev Neurol Dis. 2005. PMID: 16400311 Review.
Cited by
-
Differentiating atypical parkinsonian syndromes--a way forward?Brain Behav. 2015 Jun;5(6):e00341. doi: 10.1002/brb3.341. Brain Behav. 2015. PMID: 26085966 Free PMC article. No abstract available.
-
Parkinson's Disease Diagnostic Observations (PADDO): study rationale and design of a prospective cohort study for early differentiation of parkinsonism.BMC Neurol. 2018 May 16;18(1):69. doi: 10.1186/s12883-018-1072-x. BMC Neurol. 2018. PMID: 29764386 Free PMC article.
-
Differential diagnosis of parkinsonism by a combined use of diffusion kurtosis imaging and quantitative susceptibility mapping.Neuroradiology. 2017 Aug;59(8):759-769. doi: 10.1007/s00234-017-1870-7. Epub 2017 Jul 8. Neuroradiology. 2017. PMID: 28689259
-
Longitudinal evaluation of cerebral and spinal cord damage in Amyotrophic Lateral Sclerosis.Neuroimage Clin. 2017 Jan 24;14:269-276. doi: 10.1016/j.nicl.2017.01.024. eCollection 2017. Neuroimage Clin. 2017. PMID: 28203530 Free PMC article.
-
Differential diagnosis of parkinsonism: a head-to-head comparison of FDG PET and MIBG scintigraphy.NPJ Parkinsons Dis. 2020 Dec 11;6(1):39. doi: 10.1038/s41531-020-00141-y. NPJ Parkinsons Dis. 2020. PMID: 33311476 Free PMC article.
References
-
- Litvan I, Booth V, Wenning GK, et al. Retrospective application of a set of clinical diagnostic criteria for the diagnosis of multiple system atrophy. J Neural Transm. 1998;105(2-3):217–227. - PubMed
-
- Respondek G, Roeber S, Kretzschmar H, et al. Accuracy of the National Institute for Neurological Disorders and Stroke/Society for Progressive Supranuclear Palsy and neuroprotection and natural history in Parkinson plus syndromes criteria for the diagnosis of progressive supranuclear palsy. Mov Disord. 2013;28(4):504–509. - PubMed
-
- Postuma RB, Aarsland D, Barone P, et al. Identifying prodromal Parkinson’s disease: pre-motor disorders in Parkinson’s disease. Mov Disord. 2012;27(5):617–626. - PubMed
-
- Kalra S, Grosset DG, Benamer HT. Differentiating vascular parkinsonism from idiopathic Parkinson’s disease: a systematic review. Mov Disord. 2010;25(2):149–156. - PubMed
Publication types
MeSH terms
Grants and funding
LinkOut - more resources
Full Text Sources
Other Literature Sources
Medical
Miscellaneous
