Adaptation to fluctuating temperatures in an RNA virus is driven by the most stringent selective pressure
- PMID: 24963780
- PMCID: PMC4071030
- DOI: 10.1371/journal.pone.0100940
Adaptation to fluctuating temperatures in an RNA virus is driven by the most stringent selective pressure
Abstract
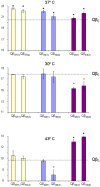
The frequency of change in the selective pressures is one of the main factors driving evolution. It is generally accepted that constant environments select specialist organisms whereas changing environments favour generalists. The particular outcome achieved in either case also depends on the relative strength of the selective pressures and on the fitness costs of mutations across environments. RNA viruses are characterized by their high genetic diversity, which provides fast adaptation to environmental changes and helps them evade most antiviral treatments. Therefore, the study of the adaptive possibilities of RNA viruses is highly relevant for both basic and applied research. In this study we have evolved an RNA virus, the bacteriophage Qβ, under three different temperatures that either were kept constant or alternated periodically. The populations obtained were analyzed at the phenotypic and the genotypic level to characterize the evolutionary process followed by the virus in each case and the amount of convergent genetic changes attained. Finally, we also investigated the influence of the pre-existent genetic diversity on adaptation to high temperature. The main conclusions that arise from our results are: i) under periodically changing temperature conditions, evolution of bacteriophage Qβ is driven by the most stringent selective pressure, ii) there is a high degree of evolutionary convergence between replicated populations and also among populations evolved at different temperatures, iii) there are mutations specific of a particular condition, and iv) adaptation to high temperatures in populations differing in their pre-existent genetic diversity takes place through the selection of a common set of mutations.
Conflict of interest statement
Figures


Similar articles
-
Evolutionary Dynamics in the RNA Bacteriophage Qβ Depends on the Pattern of Change in Selective Pressures.Pathogens. 2019 Jun 18;8(2):80. doi: 10.3390/pathogens8020080. Pathogens. 2019. PMID: 31216651 Free PMC article.
-
Stochastic temperatures impede RNA virus adaptation.Evolution. 2013 Apr;67(4):969-79. doi: 10.1111/evo.12034. Epub 2013 Jan 31. Evolution. 2013. PMID: 23550749
-
Contribution of silent mutations to thermal adaptation of RNA bacteriophage Qβ.J Virol. 2014 Oct;88(19):11459-68. doi: 10.1128/JVI.01127-14. Epub 2014 Jul 23. J Virol. 2014. PMID: 25056887 Free PMC article.
-
Adaptations to local environments in modern human populations.Curr Opin Genet Dev. 2014 Dec;29:1-8. doi: 10.1016/j.gde.2014.06.011. Epub 2014 Aug 15. Curr Opin Genet Dev. 2014. PMID: 25129844 Free PMC article. Review.
-
Dynamics of bacterial adaptation.Biochem Soc Trans. 2021 Apr 30;49(2):945-951. doi: 10.1042/BST20200885. Biochem Soc Trans. 2021. PMID: 33843990 Free PMC article. Review.
Cited by
-
Evolutionary Adaptation of an RNA Bacteriophage to Repeated Freezing and Thawing Cycles.Int J Mol Sci. 2024 Apr 29;25(9):4863. doi: 10.3390/ijms25094863. Int J Mol Sci. 2024. PMID: 38732084 Free PMC article.
-
Evolutionary Dynamics in the RNA Bacteriophage Qβ Depends on the Pattern of Change in Selective Pressures.Pathogens. 2019 Jun 18;8(2):80. doi: 10.3390/pathogens8020080. Pathogens. 2019. PMID: 31216651 Free PMC article.
-
Potentially adaptive SARS-CoV-2 mutations discovered with novel spatiotemporal and explainable AI models.Genome Biol. 2020 Dec 23;21(1):304. doi: 10.1186/s13059-020-02191-0. Genome Biol. 2020. PMID: 33357233 Free PMC article.
-
Adaptations of an RNA virus to increasing thermal stress.PLoS One. 2017 Dec 21;12(12):e0189602. doi: 10.1371/journal.pone.0189602. eCollection 2017. PLoS One. 2017. PMID: 29267297 Free PMC article.
-
The Adaptive Potential of the Middle Domain of Yeast Hsp90.Mol Biol Evol. 2021 Jan 23;38(2):368-379. doi: 10.1093/molbev/msaa211. Mol Biol Evol. 2021. PMID: 32871012 Free PMC article.
References
-
- Levins R (1968) Evolution in changing environments. Princeton Univ. Press, Princeton, NJ.
-
- Lynch M, Gabriel W (1987) Environmental tolerance. Am Nat 122: 745–764.
-
- Futuyma DJ, Moreno G (1988) The evolution of ecological specialization. Annu Rev Ecol Syst 19: 207–233.
-
- Via S (1990) Ecological genetics and host adaptation in herbivorous insects: the experimental study of evolution in natural and agricultural systems. Annu Rev Entomol 135: 421–446. - PubMed
-
- Stearns SC (1992) The evolution of life histories, Oxford Univ Press, Oxford UK.
Publication types
MeSH terms
Substances
LinkOut - more resources
Full Text Sources
Other Literature Sources

