. 2014 Jul 22;53(28):4573-89.
doi: 10.1021/bi5005206. Epub 2014 Jul 9.

Characterization of THB1, a Chlamydomonas reinhardtii truncated hemoglobin: linkage to nitrogen metabolism and identification of lysine as the distal heme ligand

Affiliations

Characterization of THB1, a Chlamydomonas reinhardtii truncated hemoglobin: linkage to nitrogen metabolism and identification of lysine as the distal heme ligand

Eric A Johnson et al. Biochemistry. .

Abstract

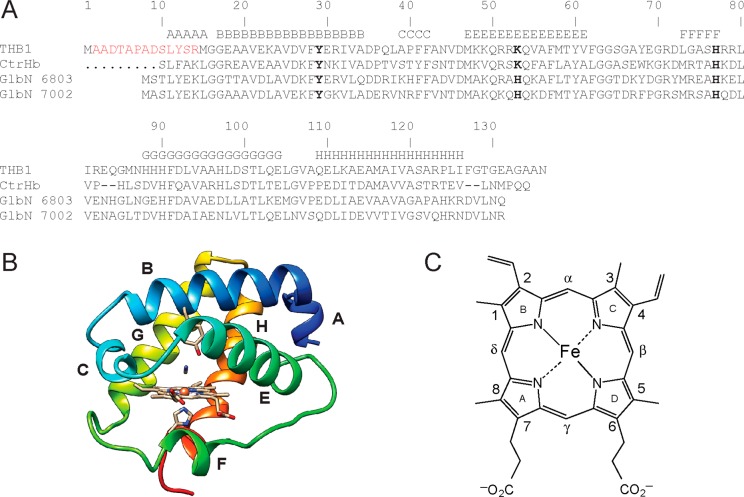
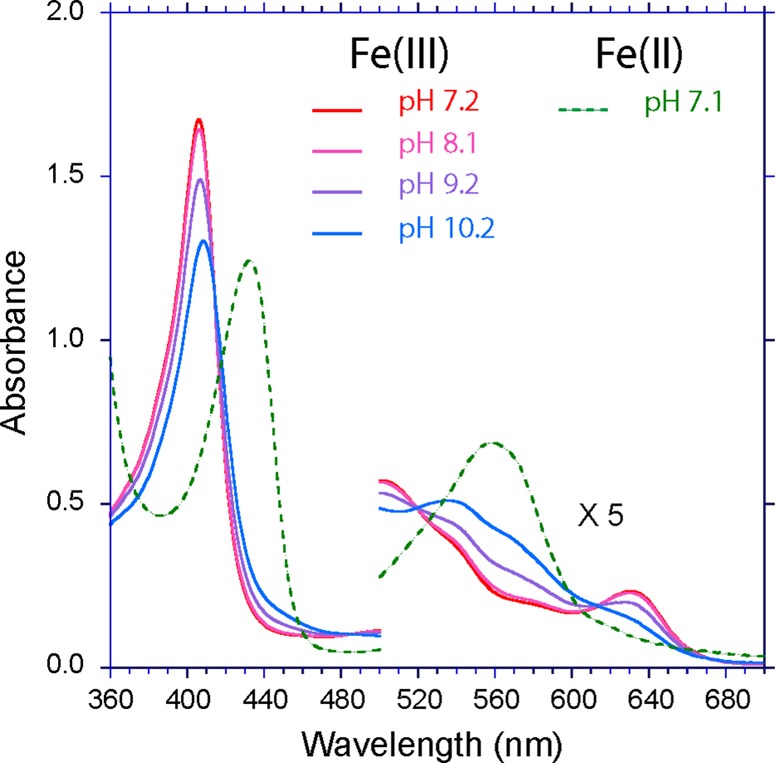
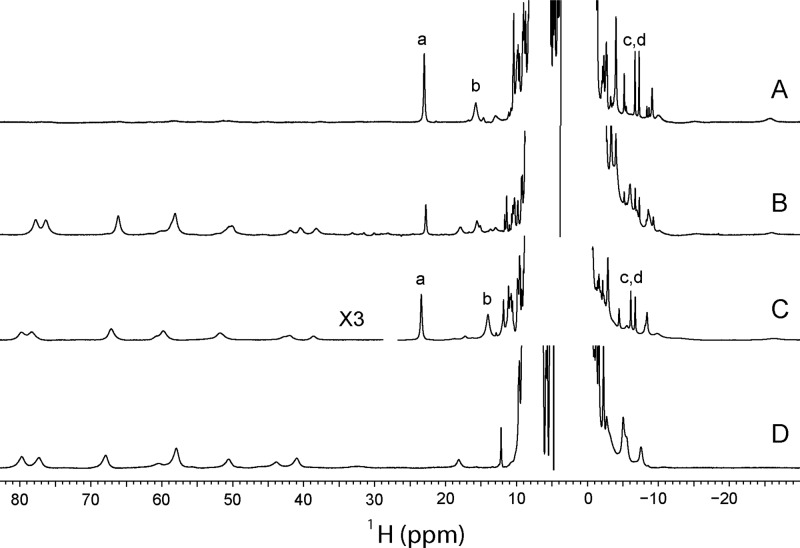
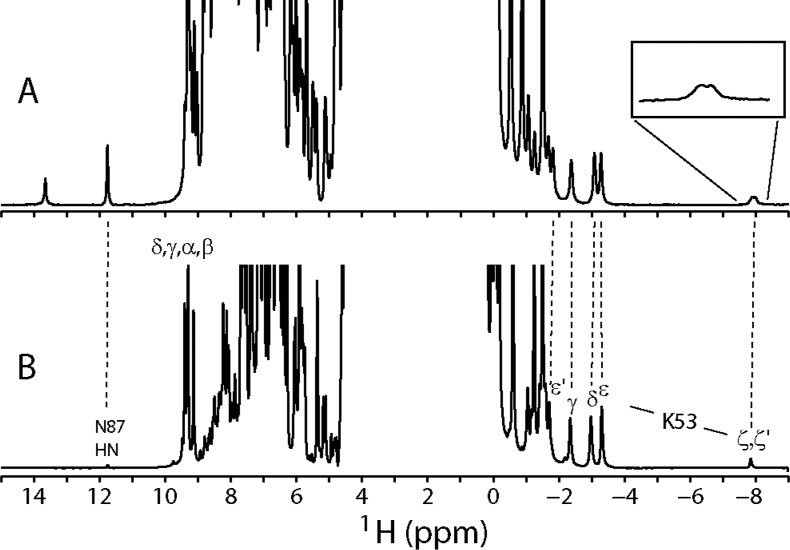
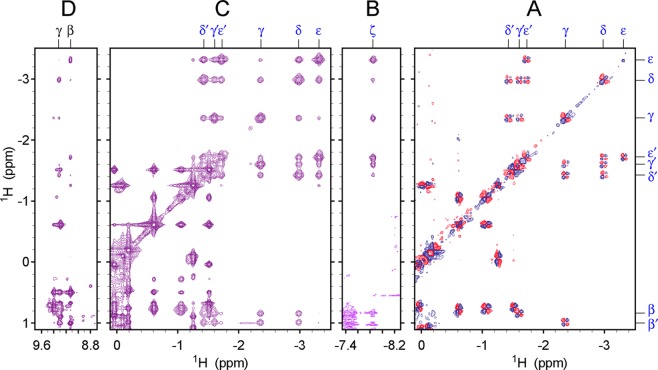
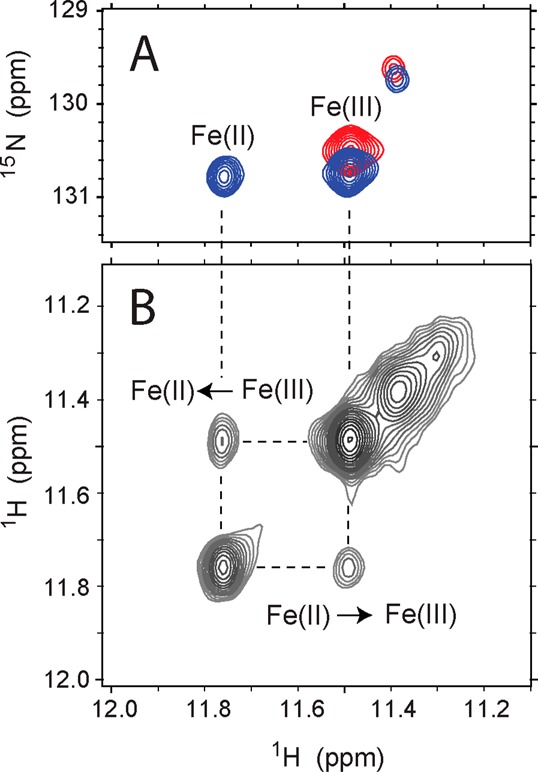
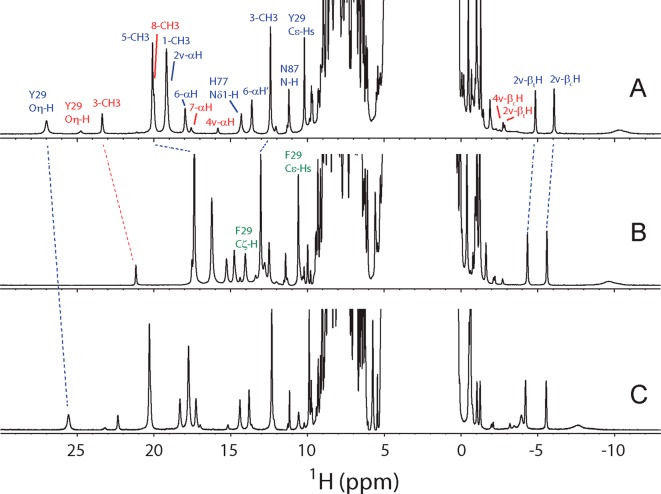
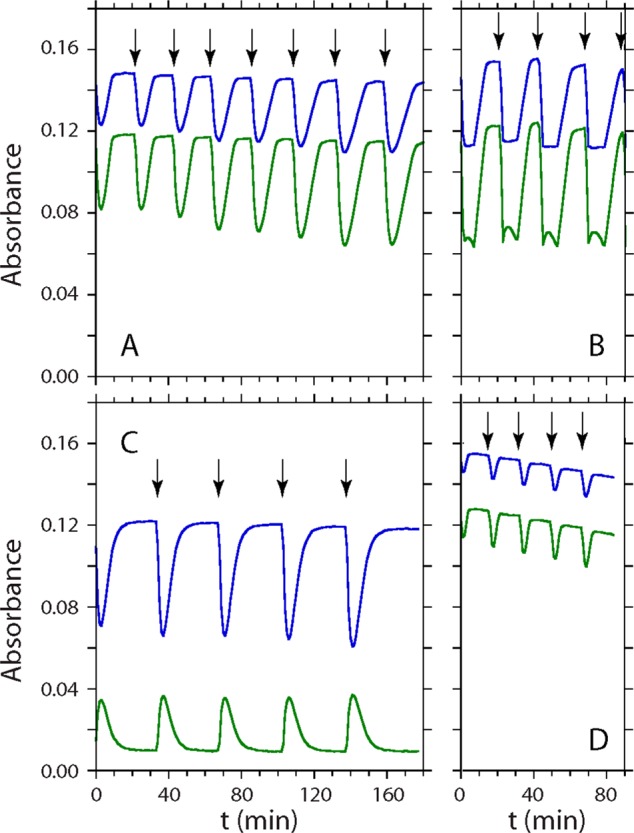
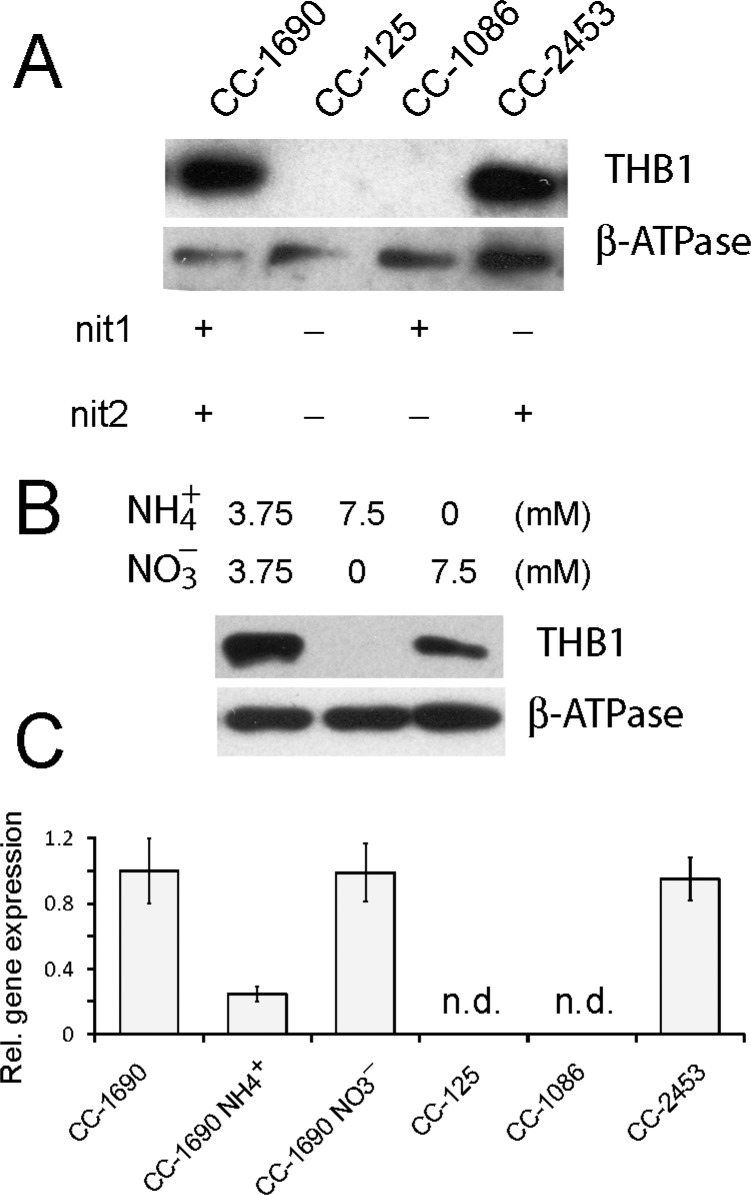
The nuclear genome of the model organism Chlamydomonas reinhardtii contains genes for a dozen hemoglobins of the truncated lineage. Of those, THB1 is known to be expressed, but the product and its function have not yet been characterized. We present mutagenesis, optical, and nuclear magnetic resonance data for the recombinant protein and show that at pH near neutral in the absence of added ligand, THB1 coordinates the heme iron with the canonical proximal histidine and a distal lysine. In the cyanomet state, THB1 is structurally similar to other known truncated hemoglobins, particularly the heme domain of Chlamydomonas eugametos LI637, a light-induced chloroplastic hemoglobin. Recombinant THB1 is capable of binding nitric oxide (NO(•)) in either the ferric or ferrous state and has efficient NO(•) dioxygenase activity. By using different C. reinhardtii strains and growth conditions, we demonstrate that the expression of THB1 is under the control of the NIT2 regulatory gene and that the hemoglobin is linked to the nitrogen assimilation pathway.


Figures

Figure 1
Figure 1
(A) Sequence alignment of THB1 and related TrHb1s: CtrHb, heme domain of C. eugametos LI637; GlbN 6803, GlbN from Synechocystis sp. PCC 6803; GlbN 7002, GlbN from Synechococcus sp. PCC 7002. The sequence numbering is for THB1. Helices are denoted A–H according to the secondary structure of CtrHb (PDB entry 1DLY) and Perutz notation. Residues of interest are His77 (the proximal histidine, His F8), Tyr29 (termed “B10” by analogy to the three-dimensional structure of mammalian Hbs), and Lys53 (“E10”). These positions are highlighted in bold. The N-terminal sequence is colored red and was used to raise anti-THB1 antibodies. (B) Structural model of THB1 prepared with SWISS-MODEL. The program selected CtrHb with bound cyanide (PDB entry 1DLY) as the best template for homology modeling. (C) b Heme structure and numbering.
Figure 2
Figure 2
Comparison of rTHB1 and in vivo THB1: (A) 1 μg of rTHB1 (lane 1) and 1 × 10⁵ cells of CC-1690 grown in Sager-Granick M medium (lane 2) analyzed via SDS–polyacrylamide gel electrophoresis (PAGE) and stained with silver and (B) 0.5 ng of rTHB1 (lane 1) and 1 × 10⁵ cells of CC-1690 grown in Sager-Granick M medium (lane 2) separated via SDS–PAGE and transferred to nitrocellulose followed by immunodetection using purified polyclonal rabbit antibodies raised against a THB1 peptide.
Figure 3
Figure 3
Absorption spectra of various forms of rTHB1 (∼10 μM, 100 mM phosphate buffer, pH 7.1). The vertical scale was adjusted to provide the extinction coefficient, ε in mM–1 cm–1. The intensity of the α–β band region was magnified by a factor of 5. (A) Ferric (green) and ferrous (blue) proteins at pH 7.1. These two spectra are reproduced with dashed lines in panels B–D. (B) Oxy (red) and carbonmonoxy (magenta) states. (C) Cyanide complexes of the ferrous (gray) and ferric (orange) states. (D) NO adducts of the ferrous (purple) and ferric (black) states.
Figure 4
Figure 4
pH titration of rTHB1. (A) The α and β bands of the ferric protein are shown between pH 10.8 and 4.8. The vertical arrows indicate the direction of the change as the pH is decreased. (B) Absorbance of the ferric protein at 540 nm as a function of pH. The solid line is the result of fitting the data according to a modified Henderson–Hasselbalch equation assuming a single ionization event [pKa = 6.48 (see the text)]. (C) Absorbance of the ferrous protein at 559 nm as a function of pH.
Figure 5
Figure 5
Optical spectrum of K53A rTHB1 in the ferric state at four pH values and in the reduced state at pH 7.1. The ferric state undergoes an aquomet–hydroxymet transition at pH >8.
Figure 6
Figure 6
One-dimensional 1H spectra of ferric rTHB1: (A) wild type at pH 7.6 (∼9% high-spin), (B) wild type at pH 5.4 (intensity ×4 compared to trace A, ∼90% high-spin), (C) Y29F variant at pH 7.0 (intensity of downfield region ×3, ∼40% high-spin), and (D) K53A variant at pH 7.4. Resonances marked a–d correspond to the 3-CH3, 8-CH3, and 2-vinyl βtrans and βcis protons, respectively, from the low-spin wild-type and Y29F species. Data were recorded in a 10% 2H2O/90% 1H2O mixture at 298 K.
Figure 7
Figure 7
1H spectra of ferrous rTHB1. One-dimensional spectra of (A) 15N-labeled wild-type rTHB1 in a 90% 1H2O/10% 2H2O mixture (pH 9.5) with amide 15N decoupling (120 ppm) during acquisition and (B) Y29F rTHB1 in a 10% 1H2O/90% 2H2O mixture (pH* 9.2). Heme meso, Asn87 NH, and resolved Lys53 signals are labeled.
Figure 8
Figure 8
Two-dimensional 1H data collected on ferrous Y29F rTHB1. (A) Upfield portion of the DQF-COSY data. (B–D) Regions of the NOESY data mapping the Lys53 spin system and indicating contact with the heme β and γ meso protons. Data were recorded in a 10% 1H2O/90% 2H2O mixture at 298 K and pH* 9.2. Blue symbols in panels A–C denote Lys53 signals. Black symbols in panel D denote heme meso signals.
Figure 9
Figure 9
ESE in wild-type rTHB1. (A) Portion of a 1H–15N HSQC spectrum collected on a 3:7 mixture of ferrous and ferric rTHB1 (blue, 1.8 mM rTHB1, pH 9.2, 298 K) superimposed over that of a sample of pure ferric rTHB1 (red, pH 7.5, 298 K). The cross peaks are from Asn87 NH. (B) Matching region of a 1H–(15NZ)–1H ZZ exchange NMR spectrum (τmix = 701 ms) recorded on the ferrous/ferric mixture. The square pattern is caused by redox interconversion.
Figure 10
Figure 10
One-dimensional 1H spectra of cyanomet rTHB1s at 298 K in a 10% 2H2O/90% 1H2O mixture: (A) wild type at pH 7.5, (B) Y29F variant at pH 7.4, and (C) K53A variant at pH 7.7. Select assignments are indicated on panels A and B as listed in Table 2 and Tables S4–S6 of the Supporting Information. Blue labels refer to the major heme orientational isomer, red labels to the minor isomer, and green labels to Phe29 within the Y29F variant.
Figure 11
Figure 11
NOD activity of rTHB1. The traces illustrate the temporal changes in absorbance in the visible region. Samples contained ∼10 μM protein in 100 mM phosphate buffer (pH 7.1) and a Fd/NADP+ reduction system. (A) Time traces at 545 nm (top line, blue) and 581 nm (bottom line, green) upon repeated addition of 1 equiv of MAHMA-NONOate to wild-type rTHB1-O2. The first addition occurred at time zero; subsequent additions are marked by vertical arrows. (B) Same as panel A, using 1.5 equiv of MAHMA-NONOate. The additional minor phase during the “turnover” period corresponds to buildup and decay of the ferric–nitrosyl adduct. (C) Time trace at 545 nm (blue) and 633 nm (green) upon repeated addition of 1 equiv of MAHMA-NONOate to K53A rTHB1-O2. (D) Time trace at 545 nm (blue) and 581 nm (green) upon repeated addition of 1 equiv of MAHMA-NONOate to Y29F rTHB1-O2.
Figure 12
Figure 12
Variation in THB1 protein levels and THB1 gene expression. (A) Western blot of whole cell extracts from C. reinhardtii strains CC-1690, CC-125, CC-1086, and CC-2453 probed with antibodies to THB1. All strains were grown in Sager-Granick M medium. The β subunit of the ATP synthase was used as a loading control. (B) Western blot of whole cell extracts probed with antibodies to THB1. Cells are from strain CC-1690 grown in Sager-Granick M medium with modifications to the nitrogen source in the media as indicated. The β subunit of the ATP synthase was used as a loading control. (C) Transcript abundances of THB1 relative to CBLP, as determined by qPCR. Averages ± the standard deviation of three independent experiments performed on a mixture of biological duplicates are shown (nd, not detected). All samples were grown in Sager-Granick M medium except “NH4+” and “NO3”, which are strain CC-1690 grown in ammonium and nitrate, respectively, as in panel B.
Figure 13
Figure 13
Test of the dependence of THB1 on BBS4 for flagellar export. Western blots of whole cells (WC), deflagellated cell bodies (CB), and isolated flagella from CC-1690 and bbs4-1 were probed with the indicated antibodies (IB). Equivalent amounts of cells and cell bodies and a 10-, 100-, or 1000-fold excess of flagella were loaded (1× is 105 whole cells or cell bodies, 10× flagella is 2 × 10⁶ flagella, etc.). The axonemal protein IC2 and the IFT protein IFT139 were used as loading controls. The β subunit of the ATP synthase was used to assess the possible level of cell body contamination of the isolated flagella. Flagellar levels of THB1, which are too high to be ascribed to cell body contamination, are equivalent in the presence (CC-1690) and absence (bbs4-1) of BBS4.

References

    1. Potts M.; Angeloni S. V.; Ebel R. E.; Bassam D. (1992) Myoglobin in a cyanobacterium. Science 256, 1690–1691. - PubMed
    1. Wittenberg J. B.; Bolognesi M.; Wittenberg B. A.; Guertin M. (2002) Truncated hemoglobins: A new family of hemoglobins widely distributed in bacteria, unicellular eukaryotes and plants. J. Biol. Chem. 277, 871–874. - PubMed
    1. Hill D. R.; Belbin T. J.; Thorsteinsson M. V.; Bassam D.; Brass S.; Ernst A.; Boger P.; Paerl H.; Mulligan M. E.; Potts M. (1996) GlbN (cyanoglobin) is a peripheral membrane protein that is restricted to certain Nostoc spp. J. Bacteriol. 178, 6587–6598. - PMC - PubMed
    1. Couture M.; Chamberland H.; St-Pierre B.; Lafontaine J.; Guertin M. (1994) Nuclear genes encoding chloroplast hemoglobins in the unicellular green alga Chlamydomonas eugametos. Mol. Gen. Genet. 243, 185–197. - PubMed
    1. Pesce A.; Couture M.; Dewilde S.; Guertin M.; Yamauchi K.; Ascenzi P.; Moens L.; Bolognesi M. (2000) A novel two-over-two α-helical sandwich fold is characteristic of the truncated hemoglobin family. EMBO J. 19, 2424–2434. - PMC - PubMed

Publication types

MeSH terms

LinkOut - more resources