

Common attentional constraints in visual foraging
- PMID: 24964082
- PMCID: PMC4071029
- DOI: 10.1371/journal.pone.0100752
Common attentional constraints in visual foraging
Abstract
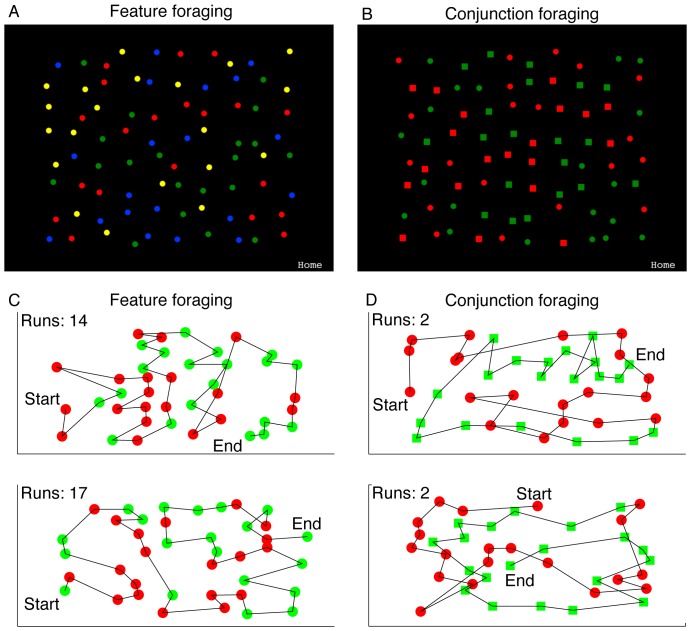
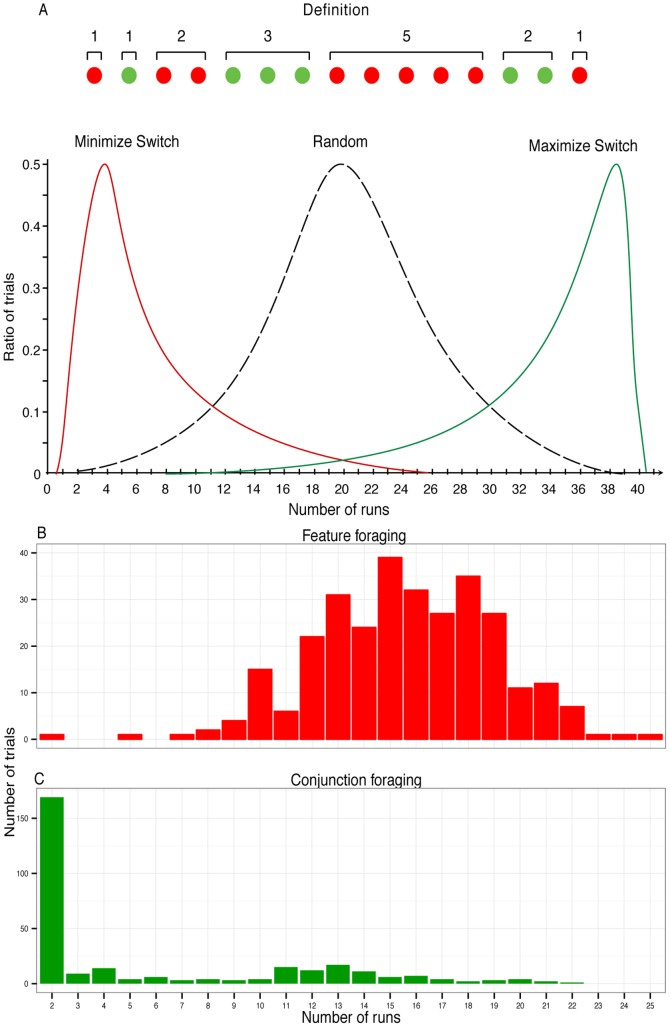
Predators are known to select food of the same type in non-random sequences or "runs" that are longer than would be expected by chance. If prey are conspicuous, predators will switch between available sources, interleaving runs of different prey types. However, when prey are cryptic, predators tend to focus on one food type at a time, effectively ignoring equally available sources. This latter finding is regarded as a key indicator that animal foraging is strongly constrained by attention. It is unknown whether human foraging is equally constrained. Here, using a novel iPad task, we demonstrate for the first time that it is. Participants were required to locate and touch 40 targets from 2 different categories embedded within a dense field of distractors. When individual target items "popped-out" search was organized into multiple runs, with frequent switching between target categories. In contrast, as soon as focused attention was required to identify individual targets, participants typically exhausted one entire category before beginning to search for the other. This commonality in animal and human foraging is compelling given the additional cognitive tools available to humans, and suggests that attention constrains search behavior in a similar way across a broad range of species.
Conflict of interest statement
Figures
Similar articles
-
Dynamics of visual attention revealed in foraging tasks.Cognition. 2020 Jan;194:104032. doi: 10.1016/j.cognition.2019.104032. Epub 2019 Aug 30. Cognition. 2020. PMID: 31476612
-
Hybrid foraging search: Searching for multiple instances of multiple types of target.Vision Res. 2016 Feb;119:50-9. doi: 10.1016/j.visres.2015.12.006. Epub 2016 Jan 20. Vision Res. 2016. PMID: 26731644 Free PMC article.
-
Foraging tempo: Human run patterns in multiple-target search are constrained by the rate of successive responses.Q J Exp Psychol (Hove). 2022 Feb;75(2):297-312. doi: 10.1177/1747021820961640. Epub 2020 Oct 8. Q J Exp Psychol (Hove). 2022. PMID: 32933424
-
Perspective: the evolution of warning coloration is not paradoxical.Evolution. 2005 May;59(5):933-40. Evolution. 2005. PMID: 16136793 Review.
-
Dangerous prey and daring predators: a review.Biol Rev Camb Philos Soc. 2013 Aug;88(3):550-63. doi: 10.1111/brv.12014. Epub 2013 Jan 21. Biol Rev Camb Philos Soc. 2013. PMID: 23331494 Review.
Cited by
-
Assessing satisfaction of search in virtual mammograms for experienced and novice searchers.J Med Imaging (Bellingham). 2023 Feb;10(Suppl 1):S11917. doi: 10.1117/1.JMI.10.S1.S11917. Epub 2023 Jul 21. J Med Imaging (Bellingham). 2023. PMID: 37485309 Free PMC article.
-
Major issues in the study of visual search: Part 2 of "40 Years of Feature Integration: Special Issue in Memory of Anne Treisman".Atten Percept Psychophys. 2020 Feb;82(2):383-393. doi: 10.3758/s13414-020-02022-1. Atten Percept Psychophys. 2020. PMID: 32291612 Free PMC article. No abstract available.
-
Attention directs actions in visual foraging.Sci Rep. 2025 May 6;15(1):15788. doi: 10.1038/s41598-025-97986-1. Sci Rep. 2025. PMID: 40328870 Free PMC article.
-
Decoding target discriminability and time pressure using eye and head movement features in a foraging search task.Cogn Res Princ Implic. 2025 Aug 22;10(1):53. doi: 10.1186/s41235-025-00657-y. Cogn Res Princ Implic. 2025. PMID: 40846822 Free PMC article.
-
Reconsidering Visual Search.Iperception. 2015 Nov 8;6(6):2041669515614670. doi: 10.1177/2041669515614670. eCollection 2015 Dec. Iperception. 2015. PMID: 27551357 Free PMC article.
References
-
- Tinbergen L (1960) The natural control of insects in pinewoods I. Factors influencing the intensity of predation by songbirds. Arch Neerl Zool 13: 265–343.
-
- Dawkins M (1971) Shifts of ‘attention’ in chicks during feeding. Anim Behav 19: 575–582.
-
- Bond AB (1983) Visual search and selection of natural stimuli in the pigeon: the attention threshold hypothesis. J Exp Psychol Anim Behav 9: 292–306. - PubMed
-
- Punzalan D, Rodd FH, Hughes KA (2005) Perceptual processes and the maintenance of polymorphism through frequency-dependent predation. Evol Ecol 19: 303–320.
-
- Bond AB (2007) The evolution of color polymorphism: Crypticity, searching images, and apostatic selection. Annu Rev Ecol Evol S 38: 489–514.
MeSH terms
LinkOut - more resources
Full Text Sources
Other Literature Sources
