

Increased ectodomain shedding of cell adhesion molecule 1 from pancreatic islets in type 2 diabetic pancreata: correlation with hemoglobin A1c levels
- PMID: 24964098
- PMCID: PMC4071031
- DOI: 10.1371/journal.pone.0100988
Increased ectodomain shedding of cell adhesion molecule 1 from pancreatic islets in type 2 diabetic pancreata: correlation with hemoglobin A1c levels
Abstract
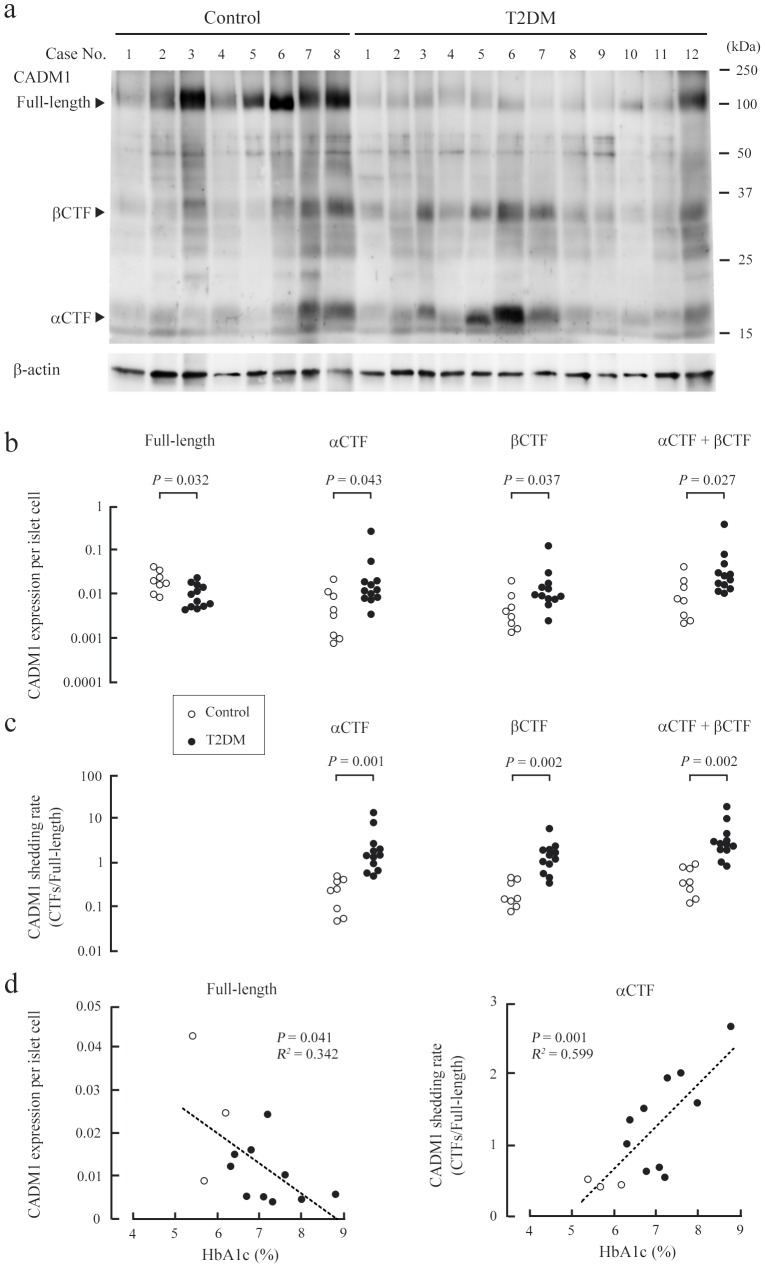
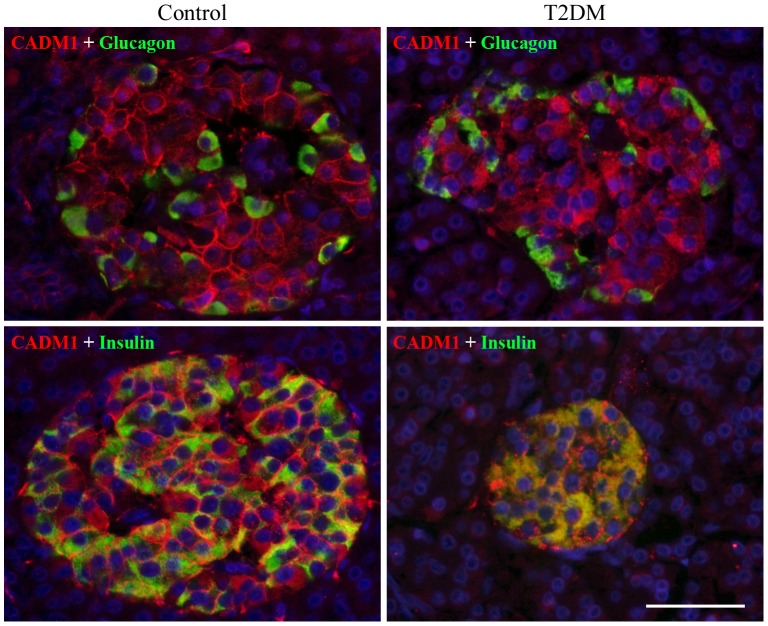
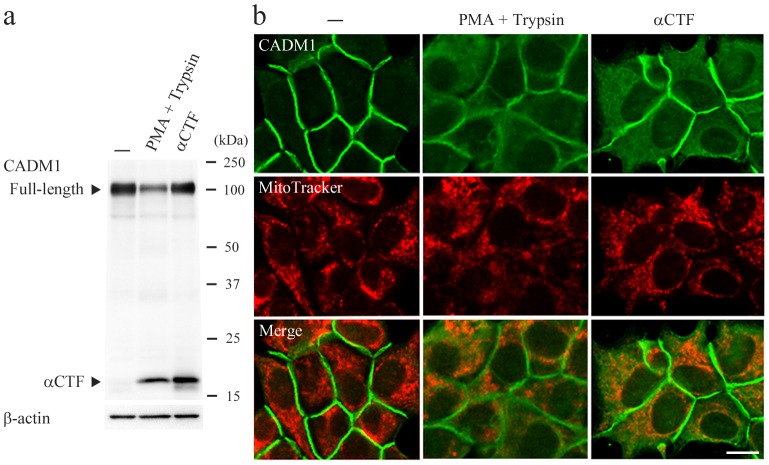
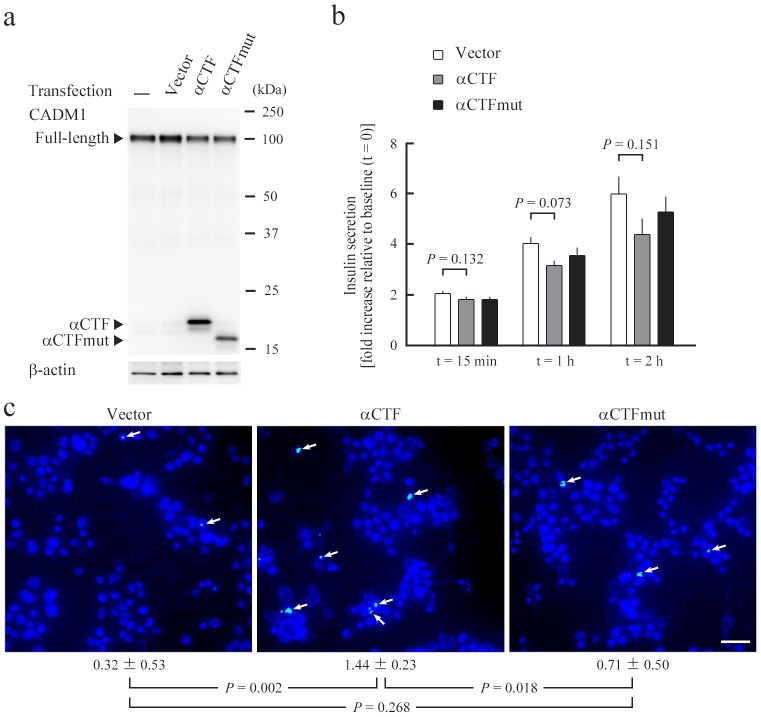
Pulmonary emphysema and type 2 diabetes mellitus (T2DM), both caused by lifestyle factors, frequently concur. Respectively, the diseases affect lung alveolar and pancreatic islet cells, which express cell adhesion molecule 1 (CADM1), an immunoglobulin superfamily member. Protease-mediated ectodomain shedding of full-length CADM1 produces C-terminal fragments (CTFs) with proapoptotic activity. In emphysematous lungs, the CADM1 shedding rate and thus the level of CTFs in alveolar cells increase. In this study, CADM1 expression in islet cells was examined by western blotting. Protein was extracted from formalin-fixed, paraffin-embedded sections of pancreata isolated from patients with T2DM (n = 12) or from patients without pancreatic disease (n = 8) at autopsy. After adjusting for the number of islet cells present in the adjacent section, we found that full-length CADM1 decreased in T2DM islets, while ectodomain shedding increased. Hemoglobin A1c levels, measured when patients were alive, correlated inversely with full-length CADM1 levels (P = 0.041) and positively with ectodomain shedding rates (P = 0.001). In immunofluorescence images of T2DM islet cells, CADM1 was detected in the cytoplasm, but not on the cell membrane. Consistently, when MIN6-m9 mouse beta cells were treated with phorbol ester and trypsin to induce shedding, CADM1 immunostaining was diffuse in the cytoplasm. When a form of CTFs was exogenously expressed in MIN6-m9 cells, it localized diffusely in the cytoplasm and increased the number of apoptotic cells. These results suggest that increased CADM1 ectodomain shedding contributes to blood glucose dysregulation in T2DM by decreasing full-length CADM1 and producing CTFs that accumulate in the cytoplasm and promote apoptosis of beta cells. Thus, this study has identified a molecular alteration shared by pulmonary emphysema and T2DM.
Conflict of interest statement
Figures
Similar articles
-
Increased ectodomain shedding of cell adhesion molecule 1 as a cause of type II alveolar epithelial cell apoptosis in patients with idiopathic interstitial pneumonia.Respir Res. 2015 Aug 1;16:90. doi: 10.1186/s12931-015-0255-x. Respir Res. 2015. PMID: 26231557 Free PMC article.
-
Increased ectodomain shedding of lung epithelial cell adhesion molecule 1 as a cause of increased alveolar cell apoptosis in emphysema.Thorax. 2014 Mar;69(3):223-31. doi: 10.1136/thoraxjnl-2013-203867. Epub 2013 Oct 2. Thorax. 2014. PMID: 24092566 Free PMC article.
-
The intracellular domain of cell adhesion molecule 1 is present in emphysematous lungs and induces lung epithelial cell apoptosis.J Biomed Sci. 2015 Aug 11;22(1):67. doi: 10.1186/s12929-015-0173-8. J Biomed Sci. 2015. PMID: 26259600 Free PMC article.
-
Multiple Functions of Cell Adhesion Molecule 1 (CADM1) and Its Role in the Pathogenesis of Cancer and Other Diseases.J Nippon Med Sch. 2025;92(2):122-131. doi: 10.1272/jnms.JNMS.2025_92-205. J Nippon Med Sch. 2025. PMID: 40399107 Review.
-
Role of the spermatogenic-Sertoli cell interaction through cell adhesion molecule-1 (CADM1) in spermatogenesis.Anat Sci Int. 2009 Sep;84(3):112-21. doi: 10.1007/s12565-009-0034-1. Epub 2009 Apr 1. Anat Sci Int. 2009. PMID: 19337787 Review.
Cited by
-
Characteristic distribution and molecular properties of normal cellular prion protein in human endocrine and exocrine tissues.Sci Rep. 2022 Sep 10;12(1):15289. doi: 10.1038/s41598-022-19632-4. Sci Rep. 2022. PMID: 36088465 Free PMC article.
-
Increased ectodomain shedding of cell adhesion molecule 1 as a cause of type II alveolar epithelial cell apoptosis in patients with idiopathic interstitial pneumonia.Respir Res. 2015 Aug 1;16:90. doi: 10.1186/s12931-015-0255-x. Respir Res. 2015. PMID: 26231557 Free PMC article.
-
Characterization of the Secretome, Transcriptome, and Proteome of Human β Cell Line EndoC-βH1.Mol Cell Proteomics. 2022 May;21(5):100229. doi: 10.1016/j.mcpro.2022.100229. Epub 2022 Apr 2. Mol Cell Proteomics. 2022. PMID: 35378291 Free PMC article.
-
Novel method for classification of prion diseases by detecting PrPres signal patterns from formalin-fixed paraffin-embedded samples.Prion. 2024 Dec;18(1):40-53. doi: 10.1080/19336896.2024.2337981. Epub 2024 Apr 16. Prion. 2024. PMID: 38627365 Free PMC article.
-
Deregulation of lncRNA HIST1H2AG-6 and AIM1-3 in peripheral blood mononuclear cells is associated with newly diagnosed type 2 diabetes.BMC Med Genomics. 2021 Jun 6;14(1):149. doi: 10.1186/s12920-021-00994-z. BMC Med Genomics. 2021. PMID: 34092238 Free PMC article.
References
-
- Nauck M, Stöckmann F, Ebert R, Creutzfeldt W (1986) Reduced incretin effect in type 2 (non-insulin-dependent) diabetes. Diabetologia 29: 46–52. - PubMed
-
- Nauck MA, Heimesaat MM, Orskov C, Holst JJ, Ebert R, et al. (1993) Preserved incretin activity of glucagon-like peptide 1 [7–36 amide] but not of synthetic human gastric inhibitory polypeptide in patients with type-2 diabetes mellitus. J Clin Invest 91: 301–307 10.1172/JCI116186 - DOI - PMC - PubMed
Publication types
MeSH terms
Substances
LinkOut - more resources
Full Text Sources
Other Literature Sources
Medical
Miscellaneous
