. 2014 Jun 26;15(1):526.
doi: 10.1186/1471-2164-15-526.

Conservation in first introns is positively associated with the number of exons within genes and the presence of regulatory epigenetic signals

Affiliations

Conservation in first introns is positively associated with the number of exons within genes and the presence of regulatory epigenetic signals

Seung Gu Park et al. BMC Genomics. .

Abstract

Background: Genomes of higher eukaryotes have surprisingly long first introns and in some cases, the first introns have been shown to have higher conservation relative to other introns. However, the functional relevance of conserved regions in the first introns is poorly understood. Leveraging the recent ENCODE data, here we assess potential regulatory roles of conserved regions in the first intron of human genes.

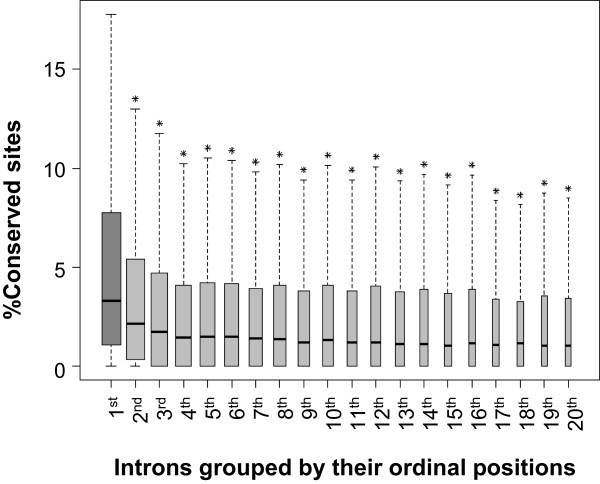
Results: We first show that relative to other downstream introns, the first introns are enriched for blocks of highly conserved sequences. We also found that the first introns are enriched for several chromatin marks indicative of active regulatory regions and this enrichment of regulatory marks is correlated with enrichment of conserved blocks in the first intron; the enrichments of conservation and regulatory marks in first intron are not entirely explained by a general, albeit variable, bias for certain marks toward the 5' end of introns. Interestingly, conservation as well as proportions of active regulatory chromatin marks in the first intron of a gene correlates positively with the numbers of exons in the gene but the correlation is significantly weakened in second introns and negligible beyond the second intron. The first intron conservation is also positively correlated with the gene's expression level in several human tissues. Finally, a gene-wise analysis shows significant enrichments of active chromatin marks in conserved regions of first introns, relative to the conserved regions in other introns of the same gene.

Conclusions: Taken together, our analyses strongly suggest that first introns are enriched for active transcriptional regulatory signals under purifying selection.


Figures

Figure 1
Figure 1
Sequence conservation in intron ordinal groups. Introns were grouped by their ordinal positions. Introns containing repeats were removed and for each remaining intron 300 bps from the 5’ as well as the 3’ end were removed to minimize interference from splicing signals (see Methods). Box plot analysis is performed for the proportions of conserved sites in introns grouped by ordinal positions from 1st introns to 20th introns. The proportions of conserved sites in first introns are represented by darker gray colors than those in the other downstream introns. The figure shows that first introns have the highest proportions of conserved sites and the proportion decreases monotonically with increasing ordinal number, stabilizing at 4th intron group. ‘*’ indicates p < 2.2e-16. Note that fewer introns are collected from the higher ordinal positions indicated by narrower box width.
Figure 2
Figure 2
Proportions of regulatory chromatin marks in intron ordinal groups. All the signals are derived from GM12878 cell line. Using the peak values for each signal, box plot analysis is performed for the proportions of the chromatin marks sites in introns from each ordinal group are estimated. Results of the same analyses in the two other cell lines are presented in Additional file 1: Figure S2A, B. The proportions of the peak signals of each chromatin regulatory marks in first introns are represented by darker gray colors than those in the other downstream introns. As shown, the proportions of the regulatory chromatin marks are found to be the highest in first introns compared to the other downstream introns.
Figure 3
Figure 3
Correlation between regulatory signals and conservation in first introns. Kendall’s tau correlation analysis is performed to test how the conservation in first introns is related to density of regulatory marks. For smoothing, introns are binned into groups of 10 genes by conservation and average regulatory signal density is calculated for each bin, and plotted against the average conservation of the group. As in Figure 2, all marks are obtained from GM12878 cell line, and the results from the other two cell lines are provided in Additional file 1: Figure S3A, B. Kendall’s tau values and p-values are shown; significant p-values (p < 0.05) are represented by bold font. All active chromatin marks show significant positive correlations between conservation and the proportions of the regulatory marks.
Figure 4
Figure 4
Relationship between intron conservation and the numbers of exons. Linear regression analysis is performed to see the relationship between the degree of conservation in introns from each ordinal position and the numbers of exons within genes. Genes are grouped by the numbers of exons within genes. For example, as shown in the top left box in the figure, genes with two exons are grouped together (named G1), the average degrees of conservations in first introns of the genes in G1 in X-axis is shown on the Y-axis. As for G1, the conservations in first introns in genes with three exons (named G2) and up to genes with twenty-one exons (named G20) are calculated. Likewise, in the box for 2nd introns (shown in blue), genes are grouped as in the first box but now the conservation in second intron is estimated; likewise for introns 3 up to 10. Note that the numbers of dots decreases by one in each subsequent box, because Nth (N>=1) introns are non-existent in genes comprising less than N numbers of exons. Regression equations and R-squared values for each linear regression analysis are shown. The collection of plots suggests that there is strong correlation between first intron conservation and number of exons, specifically for the first intron, and much lesser extent for other introns.
Figure 5
Figure 5
Relationships between the proportions of regulatory signals in introns and the numbers exons. Analysis similar to that in Figure 4 is performed but for various regulatory chromatin marks in the introns. Gene groups represented in X-axis are the same as for Figure 4, while the proportions of regulatory marks are used in Y-axis. The figure shows that the proportions of active regulatory chromatin marks in first introns produced the same ascending trend with increasing numbers of exons in genes, and the ascending trend almost disappears from second intron onward, similar to the trend seen for conservation. NA stands for “Not-Assigned” and essentially means that the median values of signals in were 0 and therefore regression could not be performed.
Figure 6
Figure 6
Relationship between expression levels of genes and the conservation in first intron. The figure shows the relationship between gene expression level and the first intron conservation for four different human tissues. Then Kendall’s tau correlation test results are shown. Conservations in first intron and upstream flanking region, but not in the downstream region, have significant positive correlations with expression levels of genes. For smoothing, genes are binned into groups of 50 by expression level. Each dot represents the mean values for conservation and the expression levels of 50 genes per bin.
Figure 7
Figure 7
Enrichment of regulatory signals in conserved portion of first intron relative to non-conserved portion. After dividing each first intron into two groups, conserved sites and non-conserved sites, log-odds ratios (X-axis) are computed with 95% confidence interval (CI) (light gray bars) for each gene. The log-odds greater than zero are represented by red dots. Each box provides the analysis result done for each regulatory mark. Y axis represents each gene corresponding to each log-odds ratio. The numbers of genes with a statistically significance (p < 0.01) divided by the total numbers of genes used for testing are presented in the middle of each box.
Figure 8
Figure 8
Comparison of trend in first and second introns after controlling for their distance from the TSS. Using the start of first exon as a proxy for the TSS, distance from the first intron and the second intron to the TSS was obtained. Additional file 1: Figure S10A shows the length distribution of the two introns. Only the introns whose distance from TSS was in the overlapping range of 500–1000 bps were included in this analysis. Within this distance range, first and second introns were partitioned into smaller distance bins, and within each bin, various marks were compared between the first and the second introns. (A) Dark gray and light gray represent the proportions estimated in the first and the second intron respectively. (B) Table for the number of genes and corresponding statistics estimated by one-sided Wilcoxon rank sum tests for each comparison illustrated in (A).

References

    1. Berget SM, Moore C, Sharp PA. Spliced segments at the 5'terminus of adenovirus 2 late mRNA. Proc Natl Acad Sci. 1977;74(8):3171–3175. doi: 10.1073/pnas.74.8.3171. - DOI - PMC - PubMed
    1. Chow LT, Gelinas RE, Broker TR, Roberts RJ. An amazing sequence arrangement at the 5′ ends of adenovirus 2 messenger RNA. Cell. 1977;12(1):1–8. - PubMed
    1. Hawkins JD. A survey on intron and exon lengths. Nucleic Acids Res. 1988;16(21):9893–9908. doi: 10.1093/nar/16.21.9893. - DOI - PMC - PubMed
    1. Deutsch M, Long M. Intron-exon structures of eukaryotic model organisms. Nucleic Acids Res. 1999;27(15):3219–3228. doi: 10.1093/nar/27.15.3219. - DOI - PMC - PubMed
    1. Simpson AG, MacQuarrie EK, Roger AJ. Eukaryotic evolution: early origin of canonical introns. Nature. 2002;419(6904):270. doi: 10.1038/419270a. - DOI - PubMed

Publication types

LinkOut - more resources