Application of immunosignatures for diagnosis of valley fever
- PMID: 24964807
- PMCID: PMC4135907
- DOI: 10.1128/CVI.00228-14
Application of immunosignatures for diagnosis of valley fever
Abstract
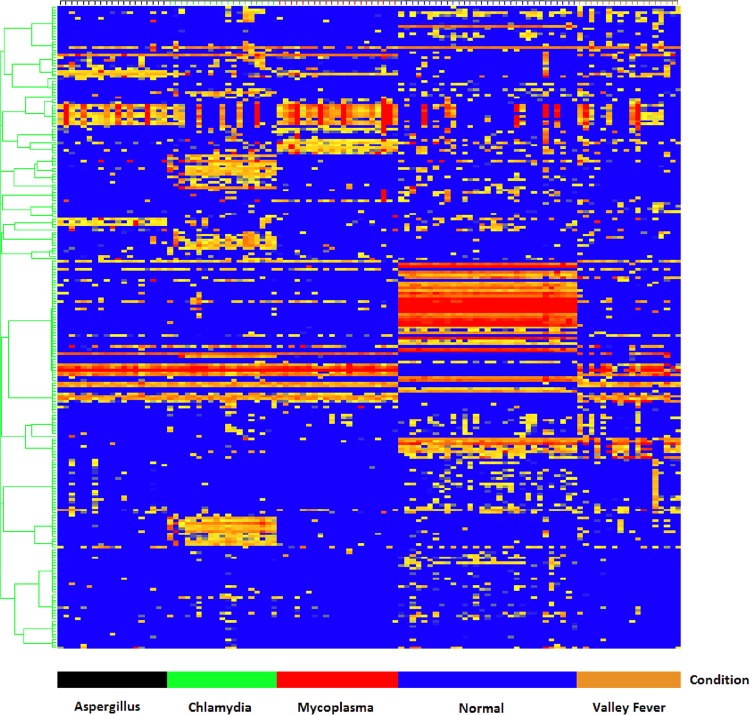
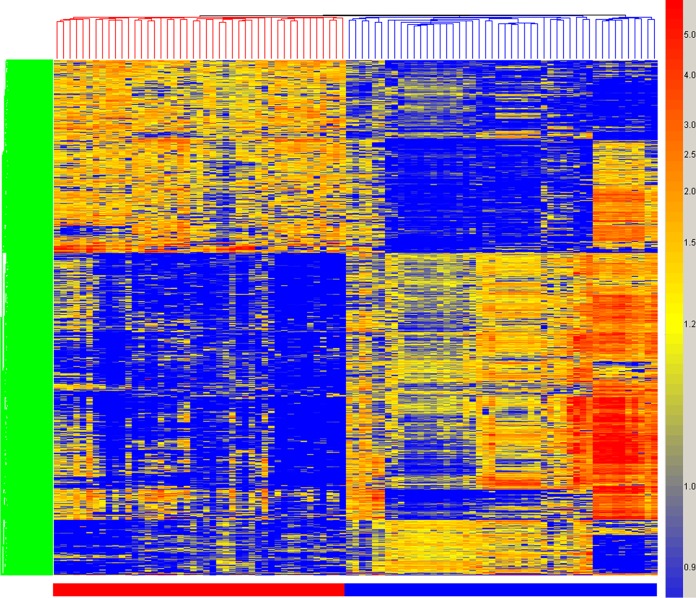
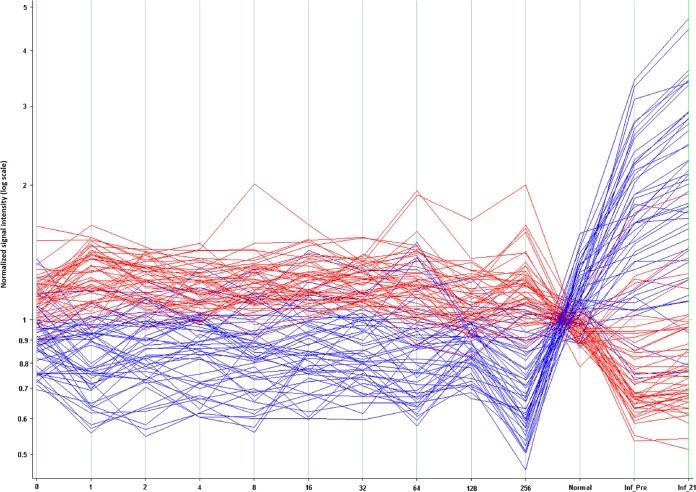
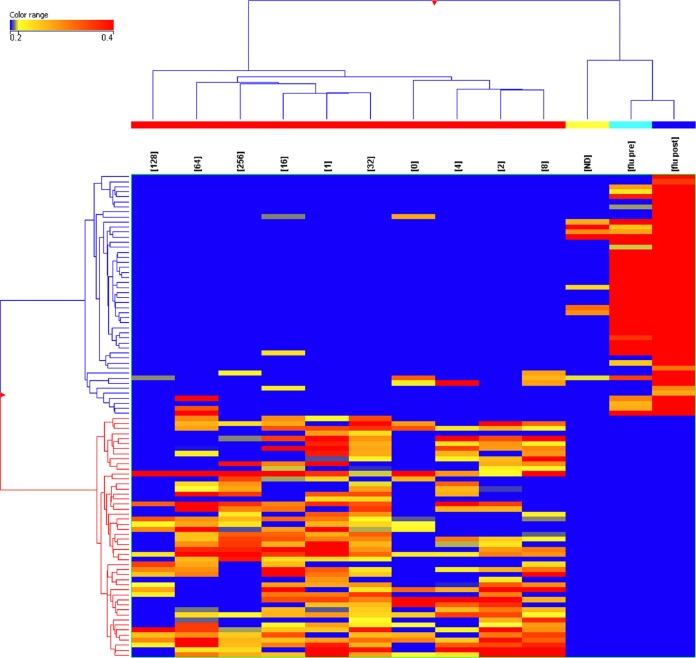
Valley fever (VF) is difficult to diagnose, partly because the symptoms of VF are confounded with those of other community-acquired pneumonias. Confirmatory diagnostics detect IgM and IgG antibodies against coccidioidal antigens via immunodiffusion (ID). The false-negative rate can be as high as 50% to 70%, with 5% of symptomatic patients never showing detectable antibody levels. In this study, we tested whether the immunosignature diagnostic can resolve VF false negatives. An immunosignature is the pattern of antibody binding to random-sequence peptides on a peptide microarray. A 10,000-peptide microarray was first used to determine whether valley fever patients can be distinguished from 3 other cohorts with similar infections. After determining the VF-specific peptides, a small 96-peptide diagnostic array was created and tested. The performances of the 10,000-peptide array and the 96-peptide diagnostic array were compared to that of the ID diagnostic standard. The 10,000-peptide microarray classified the VF samples from the other 3 infections with 98% accuracy. It also classified VF false-negative patients with 100% sensitivity in a blinded test set versus 28% sensitivity for ID. The immunosignature microarray has potential for simultaneously distinguishing valley fever patients from those with other fungal or bacterial infections. The same 10,000-peptide array can diagnose VF false-negative patients with 100% sensitivity. The smaller 96-peptide diagnostic array was less specific for diagnosing false negatives. We conclude that the performance of the immunosignature diagnostic exceeds that of the existing standard, and the immunosignature can distinguish related infections and might be used in lieu of existing diagnostics.
Copyright © 2014, American Society for Microbiology. All Rights Reserved.
Figures
Similar articles
-
Peptide based diagnostics: are random-sequence peptides more useful than tiling proteome sequences?J Immunol Methods. 2015 Feb;417:10-21. doi: 10.1016/j.jim.2014.12.002. Epub 2014 Dec 11. J Immunol Methods. 2015. PMID: 25497701
-
Diagnosis of Coccidioidomycosis with the Second-Generation Miravista IgG and IgM Enzyme Immunoassay and the Role of Adding Miravista Coccidioides Antigen Detection to Immunodiagnostic Assays.Med Mycol. 2024 Jul 4;62(7):myae063. doi: 10.1093/mmy/myae063. Med Mycol. 2024. PMID: 38871943
-
False-positive IgM serology in coccidioidomycosis.J Clin Microbiol. 2010 Jun;48(6):2047-9. doi: 10.1128/JCM.01843-09. Epub 2010 Mar 31. J Clin Microbiol. 2010. PMID: 20357210 Free PMC article.
-
Serology of coccidioidomycosis.Clin Microbiol Rev. 1990 Jul;3(3):247-68. doi: 10.1128/CMR.3.3.247. Clin Microbiol Rev. 1990. PMID: 2200605 Free PMC article. Review.
-
Scoping review of the applications of peptide microarrays on the fight against human infections.PLoS One. 2022 Jan 25;17(1):e0248666. doi: 10.1371/journal.pone.0248666. eCollection 2022. PLoS One. 2022. PMID: 35077448 Free PMC article.
Cited by
-
Time-Frequency Analysis of Peptide Microarray Data: Application to Brain Cancer Immunosignatures.Cancer Inform. 2015 Jun 18;14(Suppl 2):219-33. doi: 10.4137/CIn.s17285. eCollection 2015. Cancer Inform. 2015. PMID: 26157331 Free PMC article.
-
General Assessment of Humoral Activity in Healthy Humans.Mol Cell Proteomics. 2016 May;15(5):1610-21. doi: 10.1074/mcp.M115.054601. Epub 2016 Feb 22. Mol Cell Proteomics. 2016. PMID: 26902205 Free PMC article.
-
New approaches to understanding the immune response to vaccination and infection.Vaccine. 2015 Sep 29;33(40):5271-81. doi: 10.1016/j.vaccine.2015.06.117. Epub 2015 Jul 29. Vaccine. 2015. PMID: 26232539 Free PMC article. Review.
-
Immunosignature Analysis of Myalgic Encephalomyelitis/Chronic Fatigue Syndrome (ME/CFS).Mol Neurobiol. 2019 Jun;56(6):4249-4257. doi: 10.1007/s12035-018-1354-8. Epub 2018 Oct 8. Mol Neurobiol. 2019. PMID: 30298340 Free PMC article. Clinical Trial.
-
Entropy is a Simple Measure of the Antibody Profile and is an Indicator of Health Status: A Proof of Concept.Sci Rep. 2017 Dec 22;7(1):18060. doi: 10.1038/s41598-017-18469-6. Sci Rep. 2017. PMID: 29273777 Free PMC article.
References
-
- Centers for Disease Control and Prevention. 2009. Increase in coccidioidomycosis–California, 2000–2007. MMWR Morb. Mortal. Wkly. Rep. 58:105–109 - PubMed
Publication types
MeSH terms
Substances
LinkOut - more resources
Full Text Sources
Other Literature Sources
Medical