. 2014 Jun 25:8:78.
doi: 10.1186/1752-0509-8-78.

Analyzing networks of phenotypes in complex diseases: methodology and applications in COPD

Affiliations

Analyzing networks of phenotypes in complex diseases: methodology and applications in COPD

Jen-hwa Chu et al. BMC Syst Biol. .

Abstract

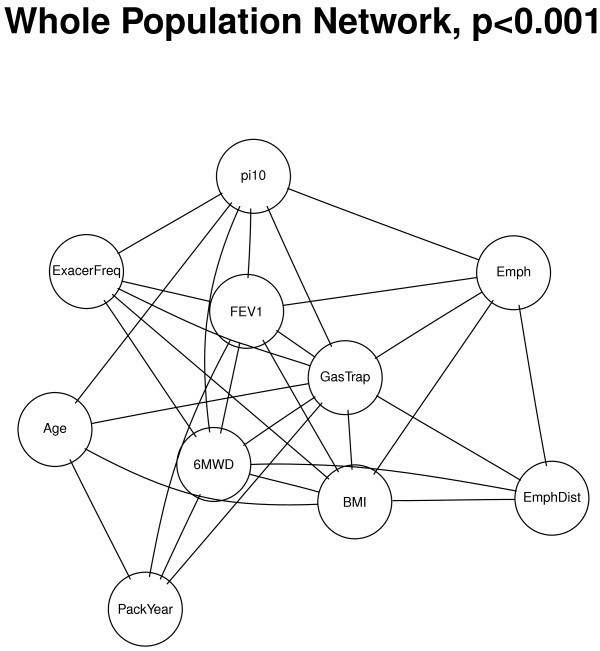
Background: The investigation of complex disease heterogeneity has been challenging. Here, we introduce a network-based approach, using partial correlations, that analyzes the relationships among multiple disease-related phenotypes.

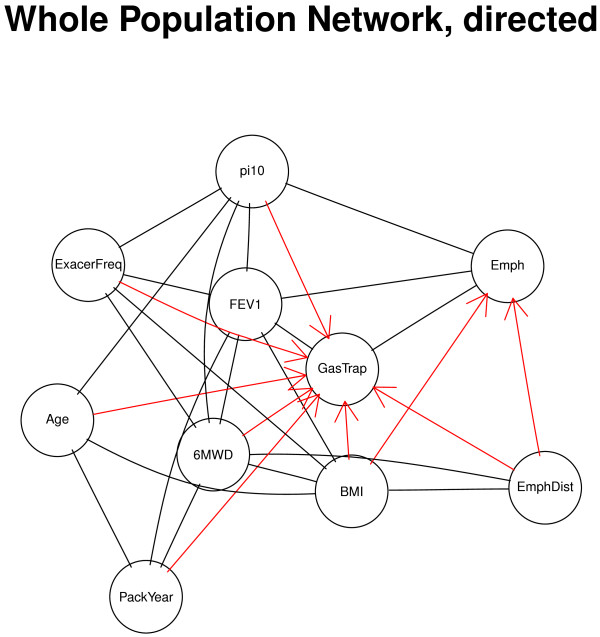
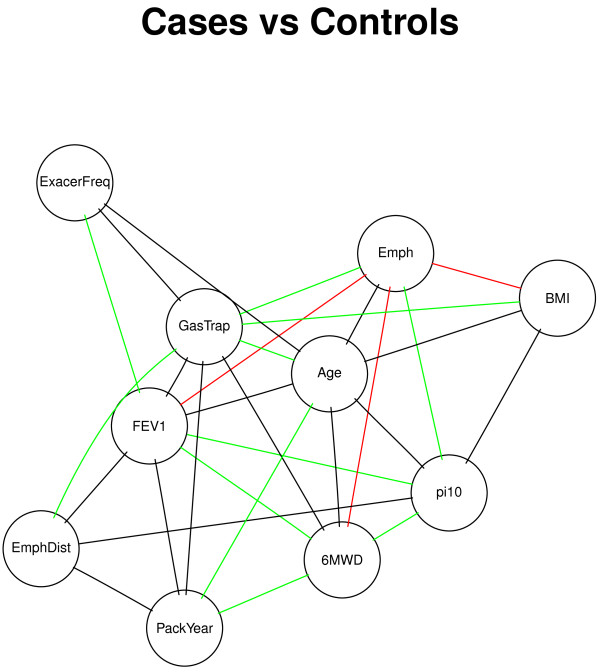
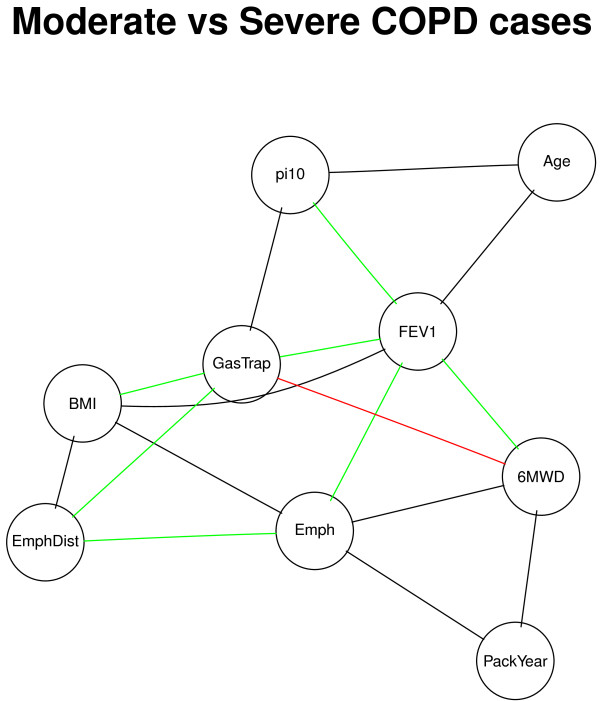
Results: We applied this method to two large, well-characterized studies of chronic obstructive pulmonary disease (COPD). We also examined the associations between these COPD phenotypic networks and other factors, including case-control status, disease severity, and genetic variants. Using these phenotypic networks, we have detected novel relationships between phenotypes that would not have been observed using traditional epidemiological approaches.

Conclusion: Phenotypic network analysis of complex diseases could provide novel insights into disease susceptibility, disease severity, and genetic mechanisms.


Figures

Figure 1
Figure 1
Whole population network (N =8,141). Undirected edges denote partial correlation coefficients that were significant at p<0.001.
Figure 2
Figure 2
Partially directed network from the whole COPDGene population (N =8,141). The topology of the network is identical to the correlation graph in Figure 1, but the edges with significant directionality are oriented.
Figure 3
Figure 3
Comparison of COPDGene case and control networks. Undirected edges represent significantly different partial correlation coefficients between case and control subjects. The green edges are present in both groups (p<0.05) and the correlations are in the same direction of effect. The red edges are present in both groups but the correlations are in the opposite direction of effect. The black edges are present in one group but not the other.
Figure 4
Figure 4
Comparison of moderate and severe COPD networks. Undirected edges represent significantly different partial correlation coefficients between moderate and severe COPD subjects. The green edges are present in both groups (p<0.05) and the correlations are in the same direction of effect. The red edges are present in both groups but the correlations are in the opposite direction of effect. The black edges are present in one group but not the other.
Figure 5
Figure 5
Partial residual plot. The partial residual plot between BMI and CT Emphysema for the smoking controls (black), moderate COPD cases (green), and severe COPD cases (red) networks. The partial residuals are the residuals of BMI and CT Emphysema from regressing out the other 8 variables.
Figure 6
Figure 6
Comparison of genetically perturbed networks. (1) HHIP in non-Hispanic White (NHW) subjects (2 copies of the COPD-risk or non-risk allele) and (2) FAM13A NHW (2 copies of the COPD-risk or non-risk allele). The green edges are present in both groups (p<0.05) and the partial correlations have the same sign, but the magnitude of effect is significantly different between genotype groups. The black edges are present in one group but not the other.

References

    1. Silverman EK. Exacerbations in chronic obstructive pulmonary disease do they contribute to disease progression? Proc Am Thorac Soc. 2007;4(8):586–590. - PMC - PubMed
    1. Barabási A-L, Gulbahce N, Loscalzo J. Network medicine: a network-based approach to human disease. Nat Genet Rev. 2011;12:56–68. - PMC - PubMed
    1. Vidal M, Cusick ME, Barabási A-L. Interactome networks and human disease. Cell. 2011;144:986–998. - PMC - PubMed
    1. Voineagu I, Wang X, Johnston P, Lowe JK, Tian Y, Horvath S, Mill J, Cantor RM, Blencowe BJ, Geschwind DH. Transcriptomic analysis of autistic brain reveals convergent molecular pathology. Nature. 2011;474:380–384. - PMC - PubMed
    1. Djebbari A, Quackenbush J. Seeded bayesian networks: constructing genetic networks from microarray data. BMC Syst Biol. 2008;2(1):57. - PMC - PubMed

Publication types

MeSH terms