. 2014 Jun 25;6(242):242ra84.
doi: 10.1126/scitranslmed.3008455.

COX-2 inhibition potentiates antiangiogenic cancer therapy and prevents metastasis in preclinical models

Affiliations

COX-2 inhibition potentiates antiangiogenic cancer therapy and prevents metastasis in preclinical models

Lihong Xu et al. Sci Transl Med. .

Abstract

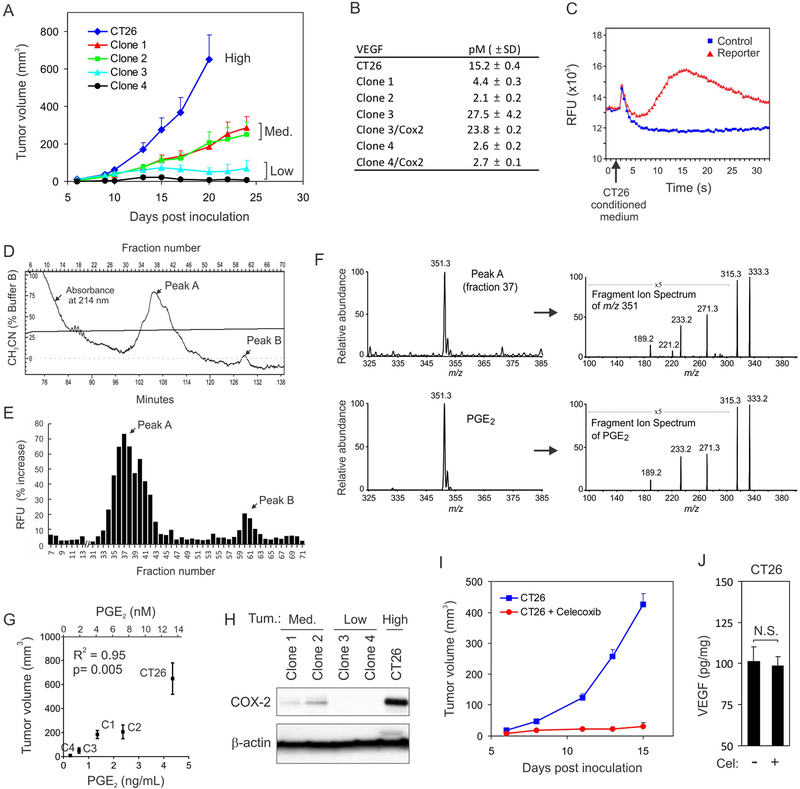
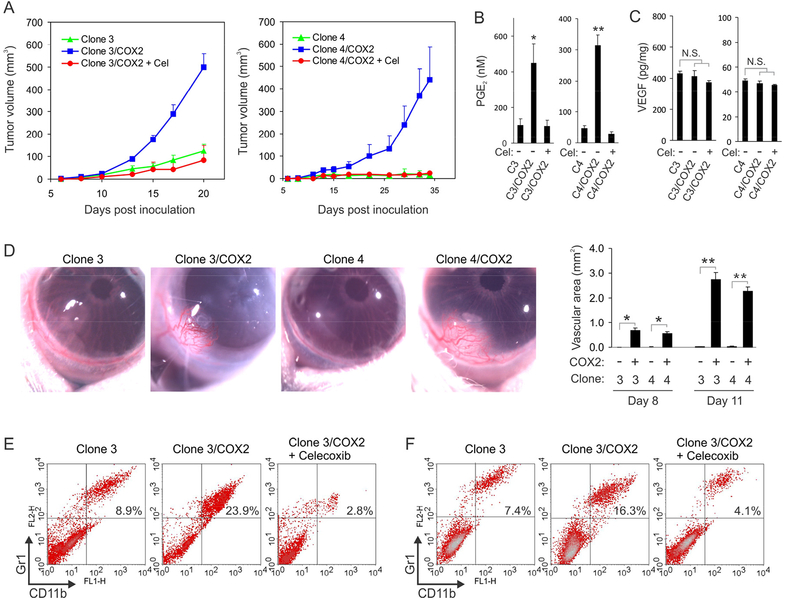
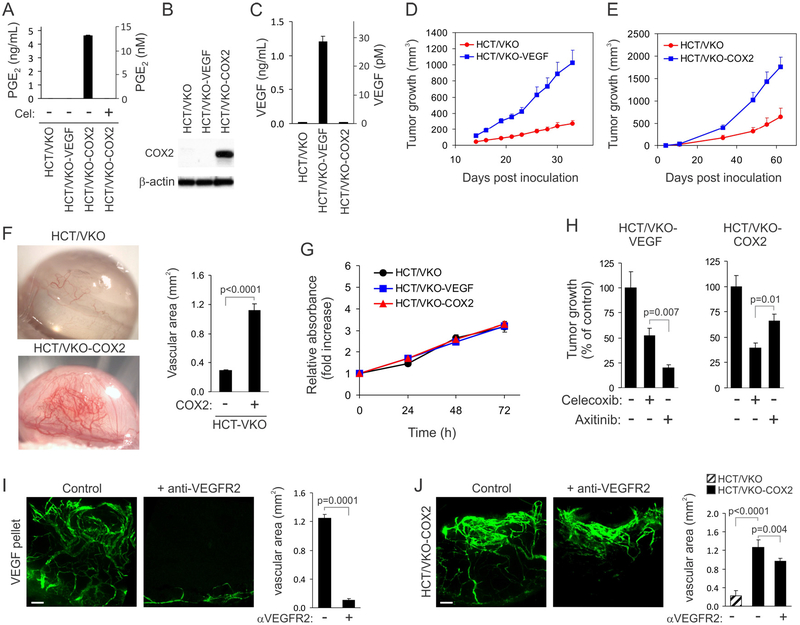
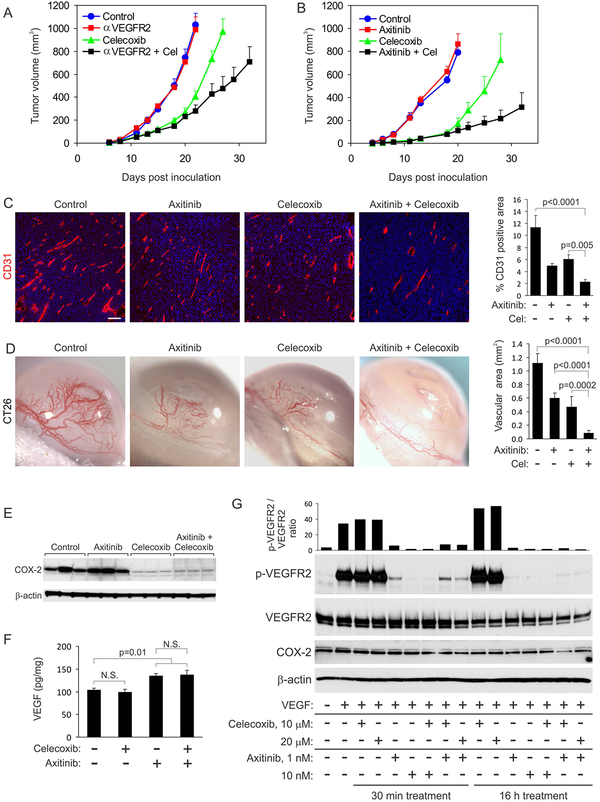
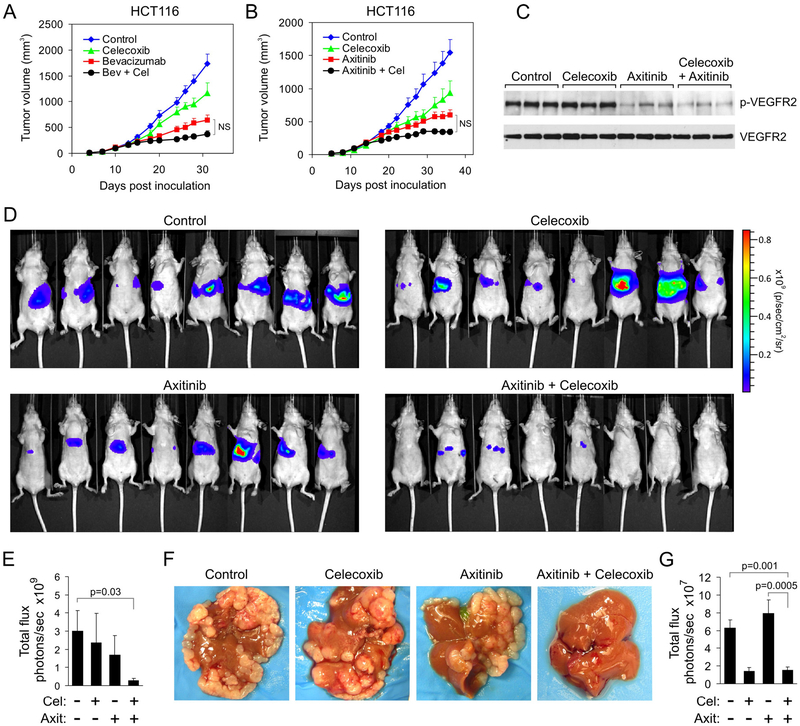
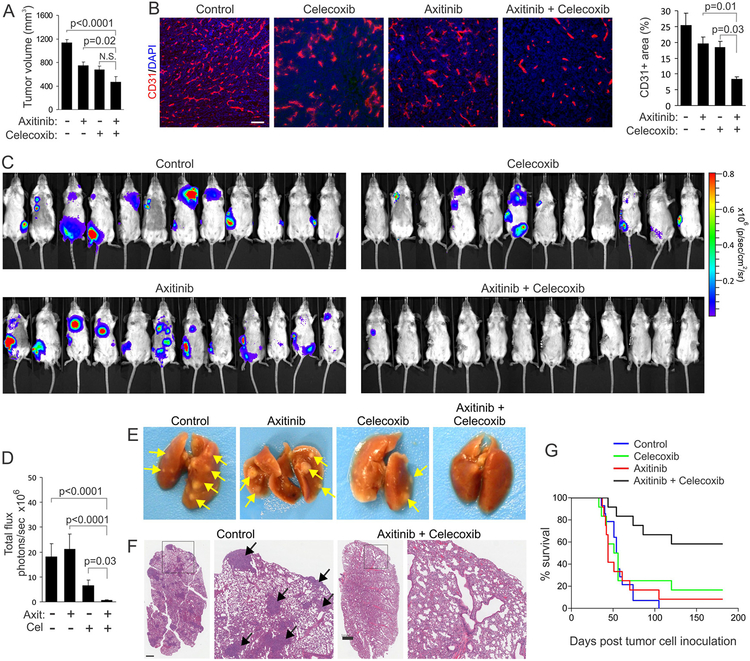
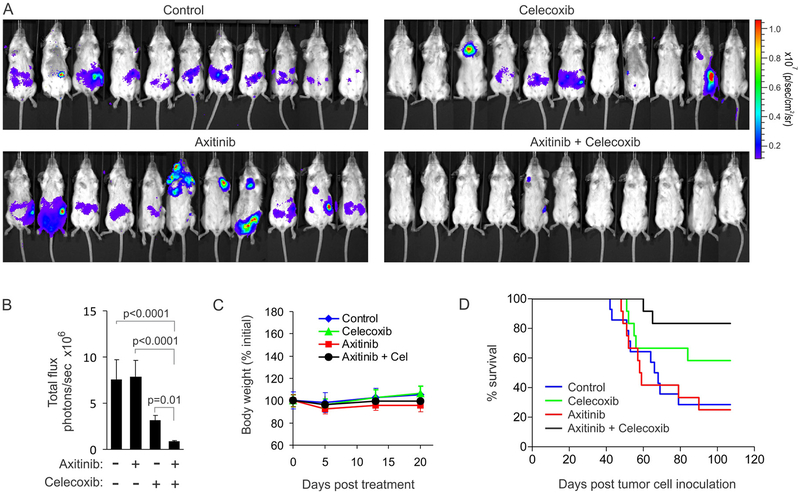
Antiangiogenic agents that block vascular endothelial growth factor (VEGF) signaling are important components of current cancer treatment modalities but are limited by alternative ill-defined angiogenesis mechanisms that allow persistent tumor vascularization in the face of continued VEGF pathway blockade. We identified prostaglandin E2 (PGE2) as a soluble tumor-derived angiogenic factor associated with VEGF-independent angiogenesis. PGE2 production in preclinical breast and colon cancer models was tightly controlled by cyclooxygenase-2 (COX-2) expression, and COX-2 inhibition augmented VEGF pathway blockade to suppress angiogenesis and tumor growth, prevent metastasis, and increase overall survival. These results demonstrate the importance of the COX-2/PGE2 pathway in mediating resistance to VEGF pathway blockade and could aid in the rapid development of more efficacious anticancer therapies.


Conflict of interest statement

Competing interests: The authors declare that they have no competing interests.

Figures

Figure 1.
Figure 1.. PGE2 is a major tumor-promoting factor produced by CT26 cells.
(A) Subcutaneous tumor growth rates for the CT26 parent cell line and its clonally derived sublines were categorized as high (CT26), medium (Med.; Clone 1, Clone 2) or low (Clone 3, Clone 4). (B) VEGF concentrations in the conditioned media of CT26-derived cell lines as measured by ELISA. (c) Conditioned medium from CT26 cells induced a robust calcium flux in reporter cells. The flux could be rapidly measured in a 96-well format using a calcium-sensitive dye. This assay was used to guide biochemical fractionation. (D) Two separate molecular entities (Peaks A and B) were visualized at 214 nm in the final HPLC column. (E) The fractions corresponding to Peak A and Peak B in (D) stimulated the highest activity in the calcium mobilization assay. (F) Electrospray ionization mass spectrometry (ESI-MS) of Fraction 37 from Peak A revealed a molecular ion (m/z 351) and corresponding fragment ion spectrum (top panel) that was identical to pure PGE2 (bottom panel). (G) Correlation between PGE2 concentration and tumor volume of CT26-derived cell lines 20 days after inoculation. (H) COX-2 protein in the CT26-derived cell lines as measured by Western blotting. (I) CT26 tumor growth with or without celecoxib treatment. P < 0.0001. (J) The amount of VEGF in CT26 tumors with or without celecoxib. N.S.: nonsignificant. Data in A, I, and J are presented as mean ± SEM.
Figure 2.
Figure 2.. Forced COX-2 expression promotes angiogenesis and tumorigenesis.
(A) CT26 Clone 3 and Clone 4 tumor growth rates were compared with their corresponding COX-2 stable transfectants (Clone 3/COX-2 and Clone 4/COX-2). The tumorigenic proficiencies of the COX-2-transfected cell lines were reversed by treatment with Celecoxib (Cel). (B) Serum PGE2 concentrations in vivo were measured in mice bearing subcutaneous tumors from CT26 Clone 3 (C3) and Clone 4 (C4) and corresponding COX-2 transfected cell lines. The impact of Celecoxib (Cel) treatment was also assessed. *p=0.007, **p<0.0001 vs. parent group, ANOVA. (C) The amount of tumor VEGF in vivo as determined by ELISA. N.S.: Non-significant.) (D) Tumor spheroids were implanted into the cornea to evaluate the role of COX-2 in tumor angiogenesis. Right panel: Quantification of corneal angiogenesis at day 8 and 11. *p=0.008, **p=0.002 versus parent group, Mann-Whitney. (E) Flow cytometry was used to quantify the percentage of Gr1+CDllb+ myeloid cells in the spleens of CT26 Clone 3 tumor-bearing mice (n=4). (F) Flow cytometry was used to quantify the percentage of Gr1+CDllb+ myeloid cells in subcutaneous CT26 Clone 3 tumors (n=4). Data are presented as mean ± SEM.
Figure 3.
Figure 3.. Expression of VEGF or COX-2 in HCT/VKO cells promotes tumorigenesis.
(A) PGE2 concentration in the conditioned media of HCT/VKO-derived cell lines as measured by ELISA. PGE2 was below the detection limit in the HCT/VKO, HCT/VKOVEGF, and celecoxib-treated HCT/VKO-COX2 cell lines. (B) COX-2 protein in HCT/VKO-derived cell lines as measured by Immunoblotting. β-actin was used as a loading control. (C) VEGF concentration in the conditioned media of HCT/VKO-derived cell lines as measured by ELISA. VEGF was not detected in the HCT/VKO and HCT/VKO-COX2 cell lines. (D) Tumor growth rates of HCT/VKO and HCT/VKO-VEGF subcutaneous xenografts.(E) Tumor growth rates of HCT/VKO and HCT/VKO-COX2 subcutaneous xenografts. (F) Tumor spheroids were implanted into the cornea to evaluate the role of COX-2 in tumor angiogenesis. Right panel: Quantification of corneal angiogenesis. P < 0.0001. (G) An Alamar blue assay was used to measure the relative growth of HCT/VKO-derived cell lines in vitro. (H) The response of HCT/VKO-VEGF (left panel) or HCT/VKO-COX2 (right panel) subcutaneous xenografts to celecoxib and axitinib was evaluated in vivo. (I) The corneal assay was used to measure the effect of systemic DC101 anti-VEGFR2 antibody treatment on VEGF-induced vascular sprouting in vivo. Bar: 100 μm. (J) The corneal assay was used to measure the effect of systemic DC101 anti-VEGFR2 antibody treatment on angiogenesis induced by HCT/VKO-COX2 spheroids. Bar: 100 μm. Data are presented as mean ± SD (A, C, and G) or mean ± SEM (D, E, F, H-J).
Figure 4.
Figure 4.. Celecoxib and axitinib modulate independent downstream signaling pathways.
(A) CT26 tumor growth rates in response to celecoxib (Cel) and DC101 (αVEGFR2). Celecoxib therapy was initiated one day after tumor cell inoculation, and DC101 therapy was initiated when tumors reached a size of ~50 mm3.(B) CT26 tumor growth rates in response to celecoxib (Cel) and axitinib. Treatments were initiated as outlined in (A). (C) Immunofluorescence staining for CD31 (red) was used to assess blood vessel densities in CT26 tumors after treatment with axitinib and celecoxib. Bar: 100 μm. Right panel: quantification of CD31 vessel staining. (D) The corneal assay was used to measure the effect of systemic axitinib and celecoxib treatment on angiogenesis induced by CT26 tumor spheroids. Right panel: quantification of the corneal angiogenesis. (E) Western blotting was used to evaluate COX-2 expression in CT26 tumors in vivo in response to axitinib and/or celecoxib (n=3 tumors per group). β-actin was used as a loading control. (E) An ELISA was used to measure the amount of VEGF in CT26 tumors after treatment with celecoxib and axitinib. (F) Western blotting was used to assess the impact of celecoxib and axitinib treatment on VEGFR2 phosphorylation and COX-2 expression in HMECs. The top bar graph displays the ratio of phosphorylated VEGFR2 to total VEGFR2. Data are presented as mean ± SEM.
Figure 5.
Figure 5.. Dual COX-2/VEGF pathway blockade suppresses colon cancer liver metastasis
(A) HCT116 tumor growth rates in response to bevacizumab (Bev) and celecoxib (Cel). All treatments were initiated when tumors reached a size of ~100 mm3. N.S: Nonsignificant. P values for the other comparisons are provided in table S1. (B) HCT116 tumor growth rates in response to axitinib and celecoxib (Cel). All treatments were initiated when tumors reached a size of ~100 mm3. N.S: Non-significant. P values for the other comparisons are provided in table S1. (C) VEGFR2 immunoprecipitation followed by western blotting was used to assess the amount of phosphorylated VEGFR2 (p-VEGFR2) in tumors in vivo after treatment with celecoxib or axitinib. (D) Bioluminescent imaging of tumor burden 14 days after intrasplenic injection of HCT116-luc cells, applying a maximum luminescence threshold of 1×10¹⁰. (E) Quantification of tumor burden shown in (D). Celecoxib (Cel); Axitinib (Axit). (F) Physical appearance of HCT116 tumor burden in the liver. (G) Whole body bioluminescent quantification 14 days after intrasplenic injection of CT26-luc cells. The whole body data are comparable to bioluminescent quantification of ex vivo livers (see fig. S12C). Cel: Celecoxib; Axit: Axitinib. Data are presented as mean ± SEM.
Figure 6.
Figure 6.. Dual celecoxib/axitinib therapy blocks spontaneous metastasis and extends survival.
(A) The orthotopic growth of 4T1-luc breast tumors in the mammary fat pad was evaluated after treatment with axitinib and celecoxib. (B) CD31 immunofluorescent staining (red) was used to assess blood vessel densities in 4T1-luc primary tumors after treatment with axitinib and celecoxib. Bar: 100 μm. Right panel: quantification of CD31 vessel staining. (C) Bioluminescent imaging of metastasis 35 days after injection of 4T1-luc cells into the mammary fat pad. Primary tumors were resected when they reached a size of ~1000 mm3. (D) Quantification of tumor burden shown in (C) applying a maximum luminescence threshold of 3×10⁷. N.S.: non-significant (n=12/group). (E) Macroscopic appearance of 4T1-luc tumor burden in the lung. Arrows: tumor nodules. (F) Microscopic appearance of 4T1-luc tumor burden in the lung after H&E staining. Arrows: tumor nodules. Bar =1 mm. (G) Kaplan-Meier survival curves were used to asses the impact of celecoxib and axitinib treatment on overall survival of the mice imaged in (C) and (D). Treatments began one day after tumor cell inoculation and continued for the duration of the study. Log-rank analysis: p=0.0001 combination vs. control, p=0.02 combination vs. celecoxib, p=0.001 combination vs. axitinib. All other comparisons were non-significant. Data are presented as mean ± SEM.
Figure 7.
Figure 7.. Dual adjuvant therapy blocks pre-established breast cancer metastasis.
(A) Bioluminescent imaging of 4T1-luc metastasis in vivo 50 days after mammary fat pad injection and 27 days after primary tumor resection. Treatments were initiated at the time of tumor resection. (B) Quantification of tumor burden shown in (A) applying a maximum luminescence threshold of 5×10⁷. Data represent mean ± SEM. (C) Body weights were monitored for 20 days after tumor resection. Data represent mean ± SD. (D) Kaplan-Meier survival curves were used to asses the impact of celecoxib and axitinib treatment on overall survival of the mice in (A-C). Log-rank analysis: p=0.007 combination vs. control, p=0.003 combination vs. axitinib, celecoxib vs. control was nonsignificant.

Comment in

  • Chemoprevention of metastasis.
    Emenaker NJ, Zudaire E, St Croix B. Emenaker NJ, et al. Oncotarget. 2014 Aug 30;5(16):6556-7. doi: 10.18632/oncotarget.2382. Oncotarget. 2014. PMID: 25179303 Free PMC article. No abstract available.

References

    1. Kerbel RS, Tumor angiogenesis. N Engl J Med 358, 2039–2049 (2008). - PMC - PubMed
    1. Patson B, C.R B, Olszanski AJ, Pharmacokinetic evaluation of axitinib. Expert Opin Drug Metab Toxicol 8, 259–270 (2012). - PubMed
    1. Bergers G, Hanahan D, Modes of resistance to anti-angiogenic therapy. Nat Rev Cancer 8, 592–603 (2008). - PMC - PubMed
    1. Chaudhary A, Hilton MB, Seaman S, Haines DC, Stevenson S, Lemotte PK, Tschantz WR, Zhang XM, Saha S, Fleming T, St Croix B, TEM8/ANTXR1 Blockade Inhibits Pathological Angiogenesis and Potentiates Tumoricidal Responses against Multiple Cancer Types. Cancer Cell 21, 212–226 (2012). - PMC - PubMed
    1. Bagri A, Kouros-Mehr H, Leong KG, Plowman GD, Use of anti-VEGF adjuvant therapy in cancer: challenges and rationale. Trends Mol Med 16, 122132 (2010). - PubMed

Publication types

MeSH terms